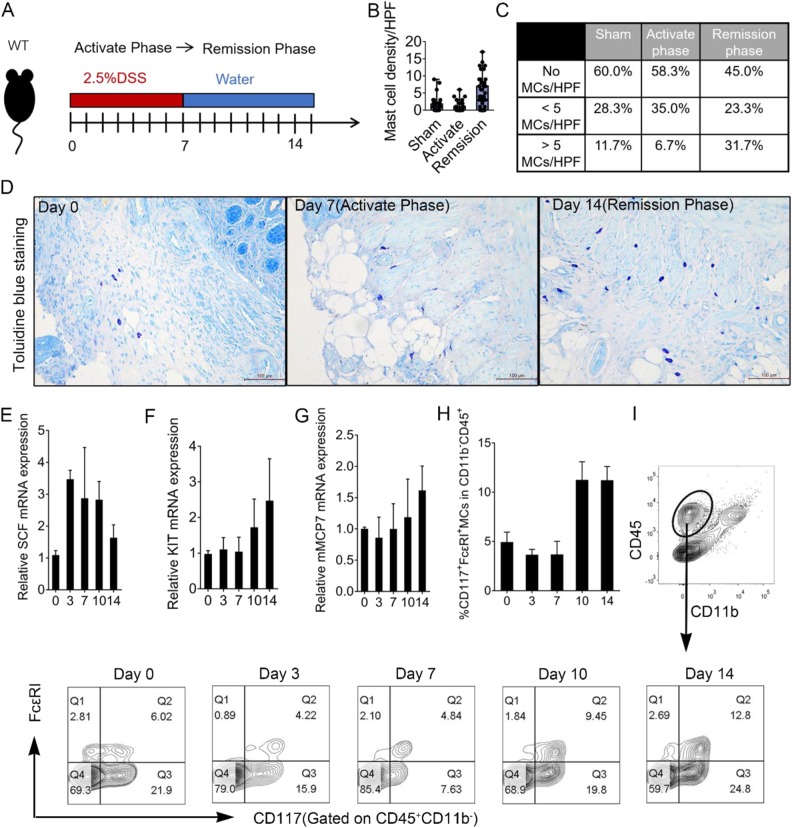
Fig. 1. MC infiltration in colon during colitis development.
a Experimental scheme of DSS administration. b, c Number and density of MCs in colon tissue section (n = 60 from 6 mice/group). d Representative toluidine blue stain of colon sections at Day 0, Day 7 (activate phase), and Day 14 (remission phase). mRNA expression for e SCF, f KIT, and g MCP-7 from real-time quantitative PCR. Data were pooled from three repeated experiments. h, i MC percentage in LP infiltrating cells analyzed by flow cytometry. Data were pooled from three different experiments. Data are presented as mean ± SD

