
Figure 3.
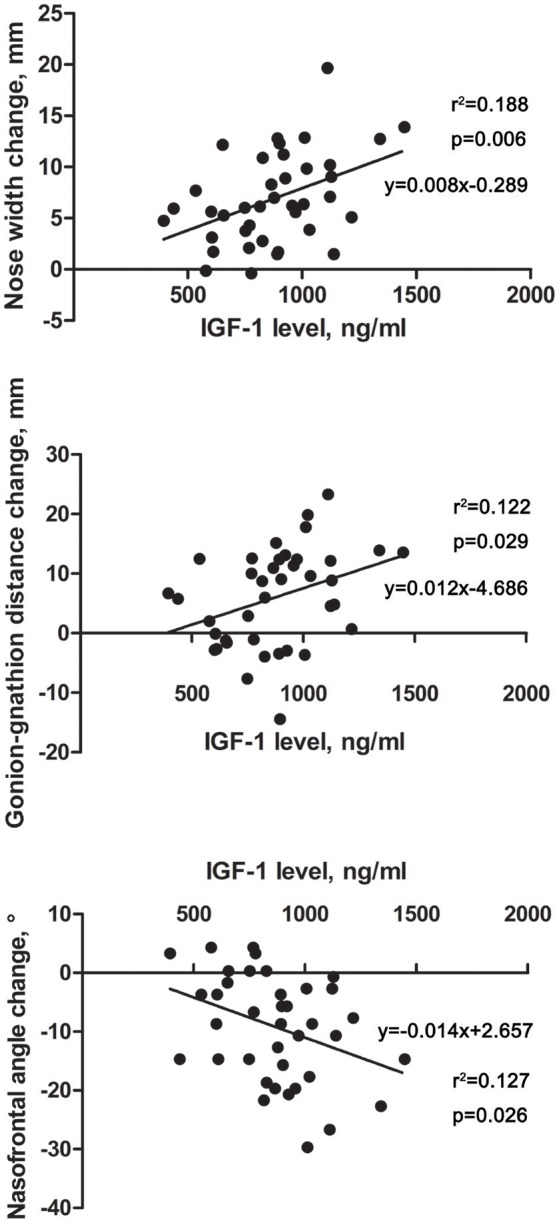
Scatter diagrams revealing the correlations between IGF-1 level and facial parameter changes in acromegaly patients. The horizontal axis indicates the level of IGF-1, and the vertical axis indicates the facial parameter changes of the acromegaly patients compared with those of the healthy controls. Each point in the scatter diagrams represents the change in one patient. Linear-regression analysis was performed, and the fitting line and formula are labeled.