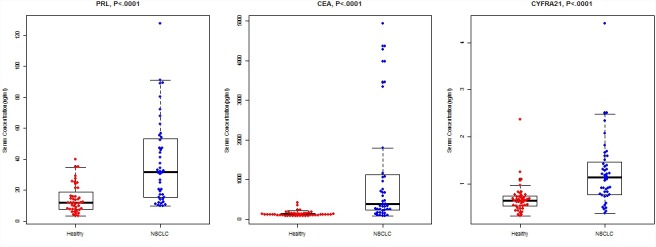
FIGURE 1.

Concentrations of PRL, CEA, and CYFRA21 between NSCLC cases and healthy controls. The bold horizontal lines in the box plots are medians, and the lower and upper limits of the boxes are 25th and 75th percentiles of values, respectively. The P-values were obtained from Mann–Whitney U-test.
