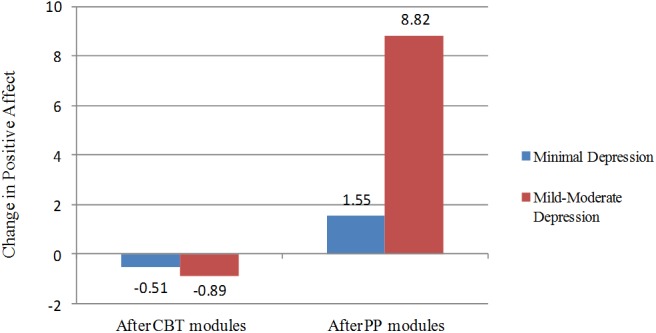
FIGURE 2.

Change in Positive Affect after the CBT modules (M1–M4) and after the PP modules (M5–M8), divided by the level of depressive symptoms. Number of participants with minimal depressive symptoms = 74; Number of participants with mild-moderate depressive symptoms = 29.
