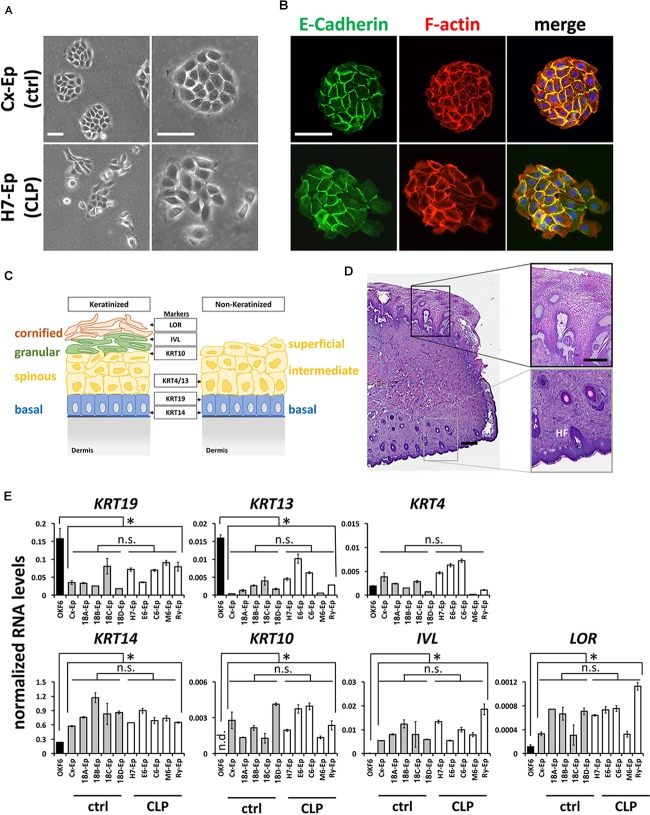
FIGURE 3.
(A) Brightfield pictures of low density cultures of foreskin-derived control cells (Cx-Ep) and CLP patient-derived keratinocytes (H7-Ep). Scale bars: 250 μm. (B) Immunofluorescent staining of E-Cadherin (green) and F-actin (phalloidin, red) of low-density Cx-Ep and H7-Ep keratinocytes. Note that epidermal keratinocytes form densely packed, regular-shaped colonies, while the oral keratinocytes grow more as scattered colonies. Scale bars: 250 μm. (C) Schematic representation of keratinized versus non-keratinized tissue, and expression sites of markers characterizing the specific cell layers: LOR, Loricrin; IVL, Involucrin; KRT4, Keratin 4; KRT10, Keratin 10; KRT13, Keratin 13; KRT19, Keratin 19; KRT14, Keratin 14. BM, basement membrane. (D) H&E staining of a cleft lip biopsy (H7 Tissue) shows the region between the oral mucosa (top) and the keratinized epidermal compartment (bottom) of the infant lip. Such biopsies are used for establishing explant cultures. Scale bars: 500 μm (left); 250 μm (close-ups, right). HF, hair follicle (E) qPCR analysis of several differentiation markers in five foreskin-derived keratinocyte cultures (ctrl), five patient-derived keratinocyte cultures (CLP), and one oral mucosal keratinocyte cell line, OKF6/TERT2. Note that the expression of the differentiation markers in both the control as well as CLP-keratinocytes is similar to each other, but statistically different to OKF6/TERT2. Data are expressed as mean ± SEM. n = 3. ∗p ≤ 0.05 control- and CLP-keratinocytes versus OKF6/TERT2. n.s.: not significant.

