FIGURE 5.
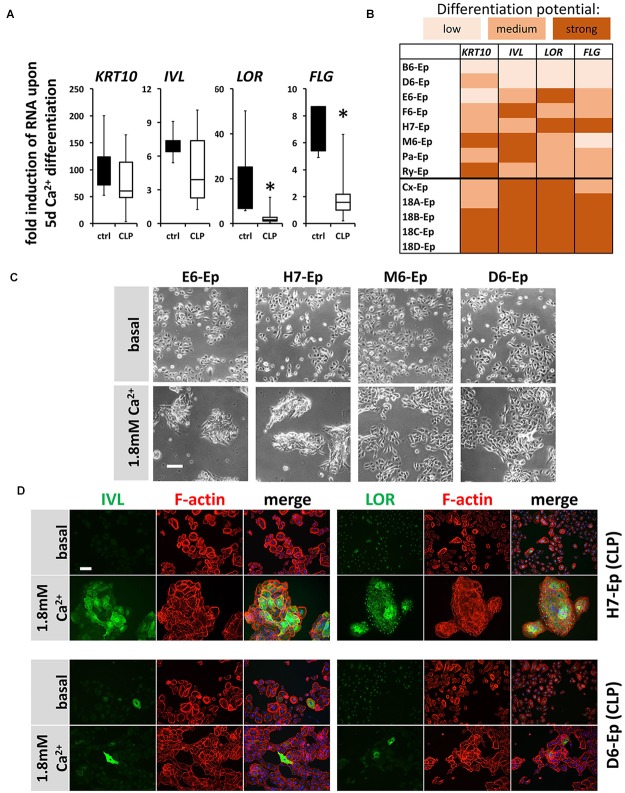
(A) Box plots showing the fold induction of specific genes (KRT10, IVL, LOR, and FLG) upon 5 days Ca2+-switch compared to their basal levels of five control keratinocyte cultures (black) and eight CLP patient-derived cell cultures (white) as assessed by qPCR analyses. Each gene in every patient line was analyzed in triplicates and the mean was used for the box plots. Note that there are statistically significant differences in the induction of the genes LOR and FLG (∗p ≤ 0.05) in control vs. CLP keratinocytes. (B) Heat map of Ca2+-induced differentiation potential of the individual keratinocyte cell cultures as assessed by qPCR analyses. Low potential: ≤50-fold induction (KRT10), ≤2-fold induction (IVL, LOR, FLG); medium potential: 50–100-fold induction (KRT10), 2–5-fold induction (IVL, LOR, FLG); strong potential: ≥100-fold induction (KRT10), ≥5-fold induction (IVL, LOR, FLG). Note that certain CLP patient-derived keratinocyte cultures, B6-Ep, D6-Ep, and M6-Ep have deficiencies in their differentiation potential in vitro induced by Ca2+-switch. (C) Live cell images of four CLP keratinocyte cultures grown for 5 days in 1.8 mM Ca2+ KSFM. Note that while the cell cultures E6-Ep and H7-Ep show clear morphological signs of differentiation, these specific morphological features are missing in the cultures D6-Ep and M6-Ep. Scale bar: 100 μm. (D) Immunofluorescent stainings for the proteins IVL (left panel) and LOR (right panel) in normally differentiating H7-Ep (top) and differentiation-deficient D6-Ep (bottom). While IVL and LOR are both strongly induced in H7-Ep, D6-Ep shows only minor elevation of both terminal differentiation proteins. Staining for IVL and LOR: green; F-actin: red, DAPI: blue. Scale bar: 50 μm. Note that the staining for LOR results in a nuclear background staining.

