FIGURE 6.
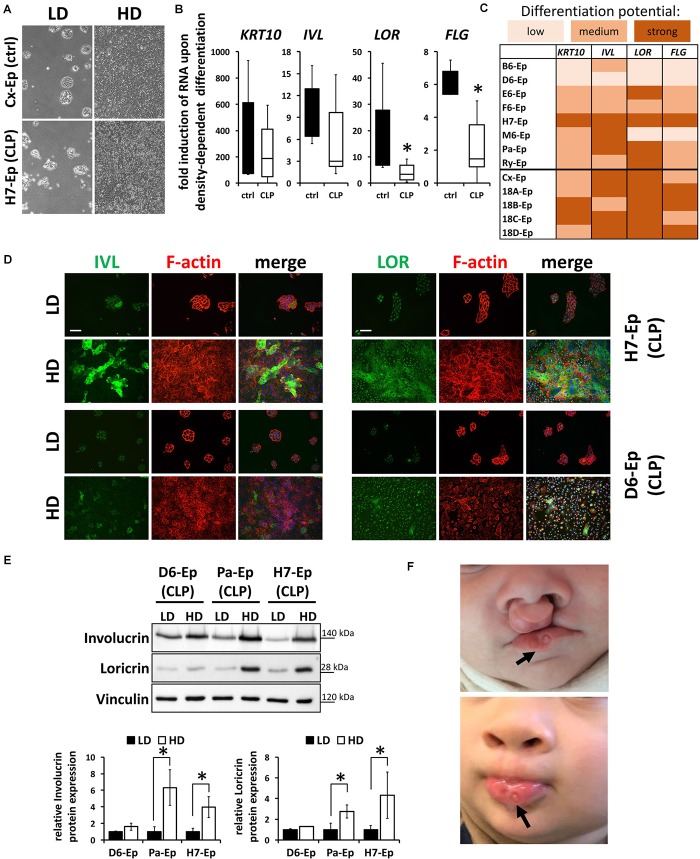
(A) Live cell images showing low-density (LD) and high-density (HD) cultures of control (Cx-Ep) and CLP keratinocytes (H7-Ep). Scale bar: 200 μm. (B) Box plots showing fold induction of the genes KRT10, IVL, LOR, and FLG upon reaching confluence (HD) compared to their levels at low-density (LD) conditions as assessed by qPCR analyses. Controls: n = 5 (black bars); CLP: n = 8 (white bars). Each gene in every patient line was analyzed in triplicates and the mean was used for the box plots. Note that there are statistically significant differences for the gene induction LOR and FLG (∗p ≤ 0.05) in control vs. CLP patient-derived keratinocytes. (C) Heat map of density-dependent differentiation potential of the individual keratinocyte cell cultures as assessed by qPCR analyses. Low potential: ≤100-fold induction (KRT10), ≤2-fold induction (IVL, LOR, FLG); medium potential: 100–500-fold induction (KRT10), 2–5-fold induction (IVL, LOR, FLG); strong potential: ≥500-fold induction (KRT10), ≥5-fold induction (IVL, LOR, FLG). Note that B6-Ep, D6-Ep, and M6-Ep fail to undergo terminal differentiation upon reaching confluence. (D) Immunofluorescent stainings for the proteins IVL (left panel) and LOR (right panel) in H7-Ep (top) and D6-Ep keratinocytes (bottom). While IVL and LOR are both strongly induced in H7-Ep, D6-Ep show defects in the induction of both terminal differentiation proteins at confluence. Staining for IVL and LOR: green; F-actin: red, DAPI: blue. Scale bar: 50 μm. Note that the staining for LOR results in a nuclear background staining. (E) Protein extracts of D6-Ep, Pa-Ep, and H7-Ep at low- (LD) and high-density (HD) were analyzed for Involucrin and Loricrin expression by immunoblotting (top panel). The blots are shown as cropped images. The full-length blots are presented in Supplementary Figure S6. Densitometrical quantification of the immunoblots is shown in the bottom panels. Data are expressed as mean ± SEM. n = 3. Note that protein levels correlate with RNA levels. (F) Clinical manifestation of the newborn who donated the lip tissue from which the primary cell culture D6-Ep had been derived before (top) and after surgery (bottom). Note the presence of lip pits in the lower lip (arrows), which is a diagnostic feature of van der Woude Syndrome. Written informed consent was obtained from the parents of the individual for the publication of these images.

