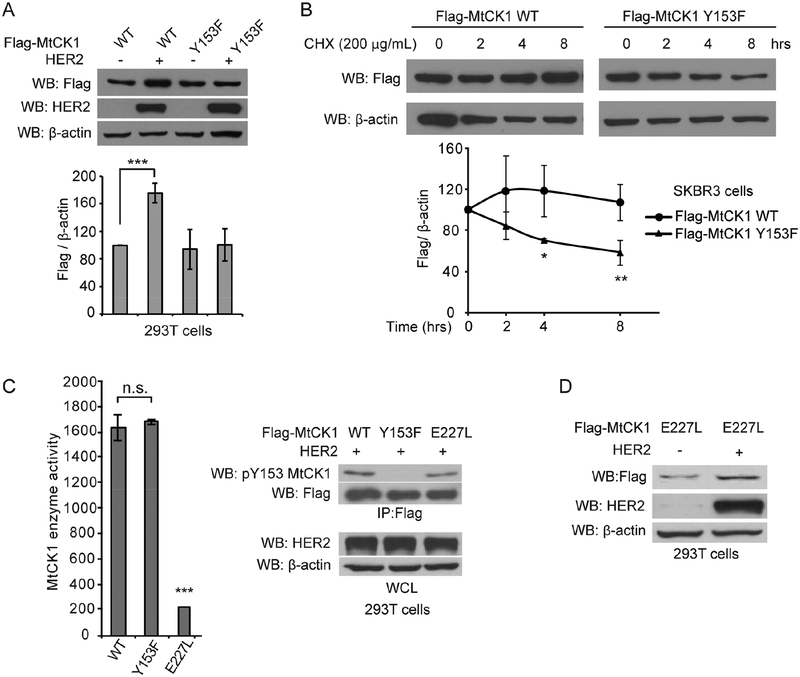
Figure 2. Stability of MtCK1 is enhanced by HER2 signaling independent of MtCK1 enzymatic activity.
(A) Top: Immunoblots of lysates from 293T cells co-expressing Flag-MtCK1 WT or Y153F along with vector control (−) or HER2 WT. Bottom: Densitometric quantification of four independent anti-Flag and anti-β-actin immunoblots based on the densitometric analysis showing a dose-dependent linear correlation of anti-Flag and anti-β-actin immunoblots of the lysates (Figure S2A). (B) Top: Immunoblots of SKBR3 cells stably expressing Flag-MtCK1 WT or Y153F that were treated with 200 μg/ml cycloheximide (CHX) for the indicated times. Bottom: Densitometric quantification of three independent anti-Flag and anti-β-actin immunoblots. (C) Left: MtCK1 enzyme activity in anti-Flag immunoprecipitates from 293T cells co-expressing Flag-MtCK1 WT, MtCK1 Y153F or MtCK1 E227L and HER2. Right: Immunoblots of the corresponding anti-Flag immunoprecipitates (IP) and whole-cell lysates (WCL) from 293T cells. (D) Immunoblots of 293T cells co-expressing either vector control (−) or HER2 and Flag-MtCK1 E227L. All results are representative experiments of three independent replicates. P values were determined by a two-tailed Student’s t test (*P<0.05, **P<0.01, ***p < 0.001).

