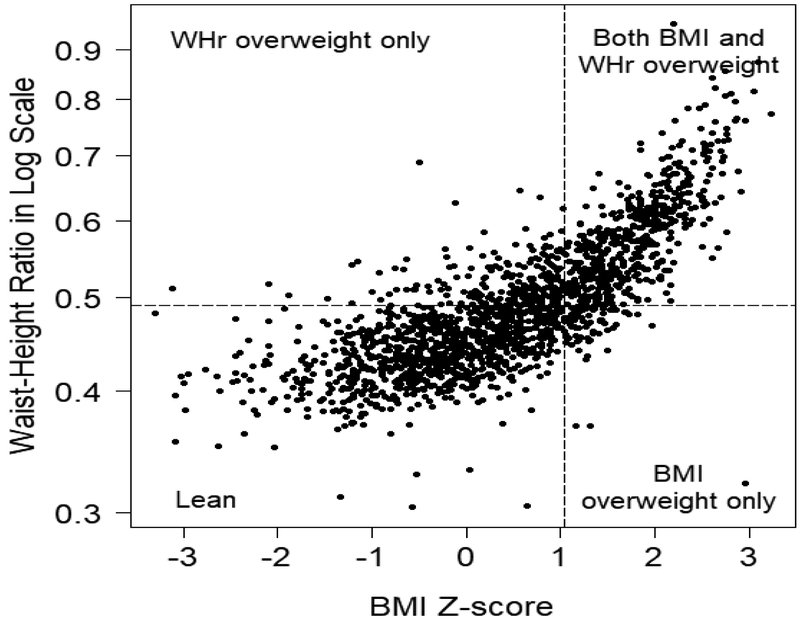
Figure 1. Distribution of weight status by study visit.
The distribution of WHr and BMI z-scores are plotted over all study visits (n=1723) and weight classified as lean (WHr≤0.49, BMI <85th percentile), WHr overweight only (WHr >0.49, BMI <85th percentile), BMI-overweight only (WHr ≤0.49, BMI ≥85th percentile), or overweight by both BMI and WHr (WHr >0.49, BMI ≥85th percentile).

