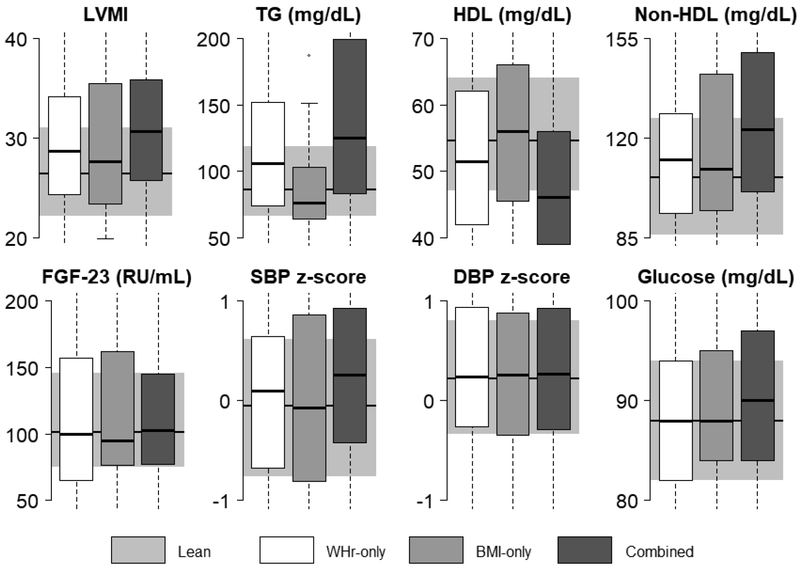
FIGURE 2. Distribution of CV markers by weight status.
CV markers (median and IQR) are illustrated by weight classification. Overweight by WHr-only, BMI-only, and combined (overweight by both WHr and BMI) groups are shown in the white, light gray, and dark gray bars, respectively, overlaying a shaded gray box representing the lean group. Due to the longitudinal nature of the data, bivariate statistical tests of significance were not appropriate; this figure represents a descriptive presentation of the data only.

