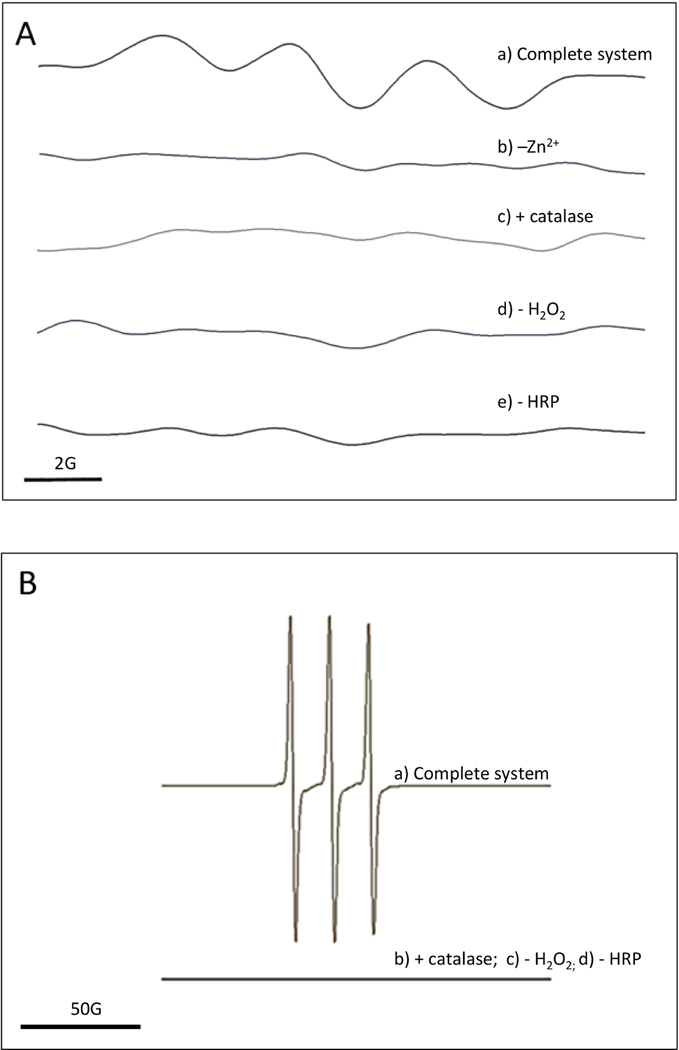
Figure 4.

A) EPR detection of catechin phenoxyl radical. EPR spectra were recorded using the parameters specified under Materials and Methods, a) Complete system: the complete system consisted of 20 mM Mes buffer pH 5.5 with 200 mM ZnSCU, 1 mM H2O2, 0.5 U/mL horseradish peroxidase and 1 mM catechin; b) -Zn2+: ZnSCL was omitted from the complete system; c) + catalase: catalase at 1000 U/mL was added to the complete system; d) -H2O2: H2O2 was omitted from the complete system; e) -HRP: horseradish peroxidase was omitted from the complete system. B) EPR detection of CPH oxidation by catechin phenoxyl radical. EPR spectra were recorded using the parameters specified under Materials and Methods, a) Complete system: the complete system consisted of 20 mM Mes buffer pH 5.5, 1 mM H2O2, 0.5 U/mL horseradish peroxidase, 0.3 mM CPH and 1 mM catechin; b) + catalase: catalase at 1000 U/mL was added to the complete system; c) -H2O2: H2O2 was omitted from the complete system; d) - HRP: horseradish peroxidase was omitted from the complete system.
