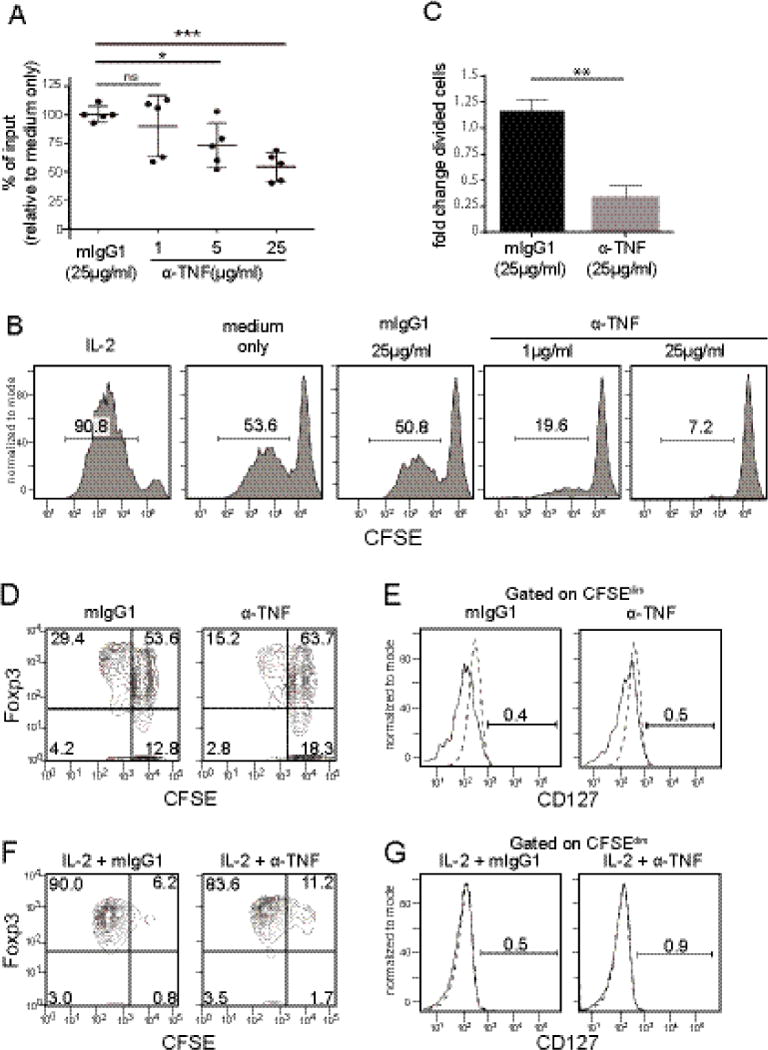
Fig.2. Effect of TNF inhibition on Treg proliferation.

Tregs isolated from peripheral blood were labeled with CFSE and stimulated by plate- bound anti-CD3 and soluble anti-CD28 in the presence of anti-TNF or isotype control antibody (mIgG1) for 5 days. (A) Proliferation of Tregs in response to TNF inhibition. All conditions were cultured with anti-IL-2. Percent input was calculated by counting cell number in comparison to untreated control. Bars represent mean and standard deviation. Statistical analysis by one-way ANOVA with Dunnett’s multiple comparisons test (*p=0.011, ***p=0.0002). (B) Proliferation of Tregs measured by CFSE. Cells were treated with the addition of factors indicated above each panel. All conditions received anti-IL2 Ab except for the control with exogenous IL-2 added. Representative data from 4 donors. (C) Fold change of divided cells (CFSEdim) in response to TNF inhibition. Fold change calculated by percent divided cells in treated sample/untreated control (n=4) and analyzed by paired t-test; p=0.0066. (D) Proliferation of Tregs. After 5 days of treatment with isotype control (mIgG1) or anti-TNF (25 μg/mL), CFSE-labeled cells were stained for Foxp3 then analyzed by flow cytometry. Data are representative of two independent experiments (n=2). (E) Expression of CD127 among CFSEdim cells as gated in 2D. Dashed lines indicate isotype control (n=2) (F) Proliferation of Tregs with exogenous IL-2 and isotype control (mIgG1) or anti-TNF (25 μg/mL). After 5 days CFSE labeled cells were stained for Foxp3 and analyzed by flow cytometry. Data are representative of two independent experiments (n=2). (G) Expression of CD127 among CFSEdim cells as gated in 2F (n=2).
