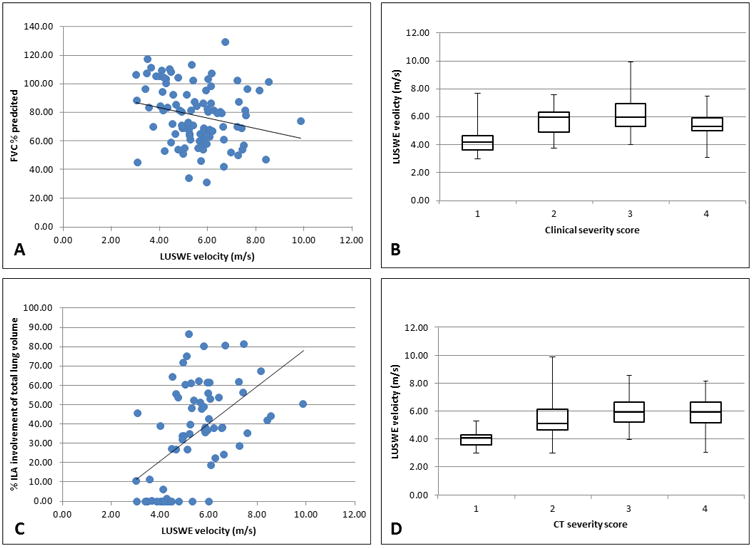
Figure 3.

Linear regression analysis shows a weak negative correlation between FVC % predicted and LUSWE velocity in (A) and a weak positive correlation between CALIPER-detected ILA and LUSWE velocity (C). Median analysis shows quintiles of LUSWE velocity by clinical severity score in (B) and by radiologist-assessed CT severity score (D). All velocities were measured in the right lower lateral lung zone.
