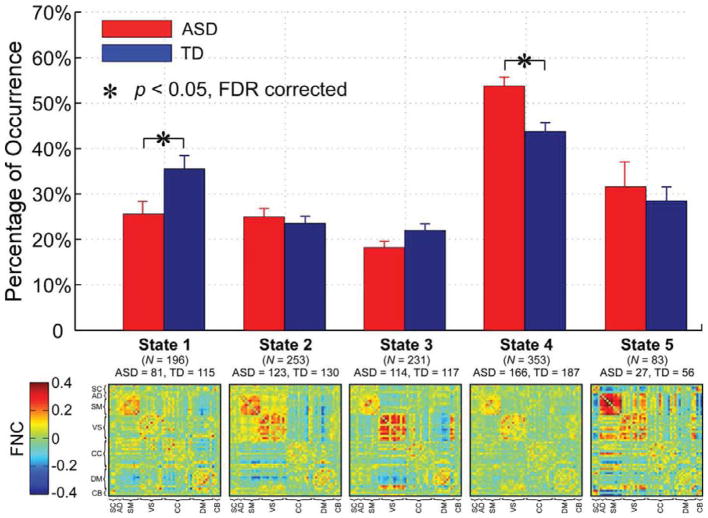
Figure 3.
Upper: group difference in percentage of occurrences of five functional states. Bar represents the mean occurrence of each state, while error bar represents the standard error of mean of occurrence. Two out of five states have significant group difference. Asterisks indicate the significance (FDR corrected, q = 0.05). Lower: the cluster centroids of five functional states, along with the count of subjects that have at least one window clustered into each state.

