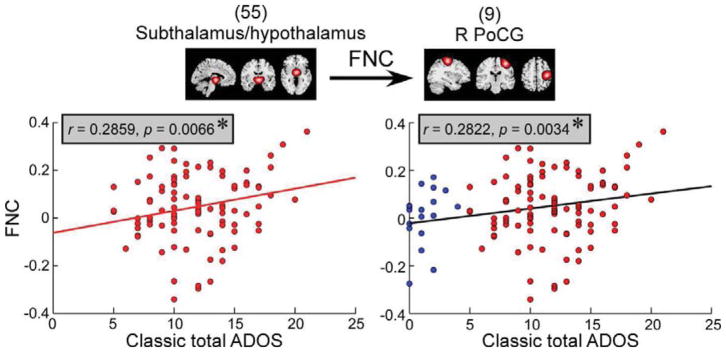
Figure 5.
The scatter plots illustrate the association between classic total ADOS and functional connectivity between hypothalamus/subthalamus and right postcental gyrus (R PoCG) in functional state 2 in ASD group/whole samples. Red circles represent the individuals with ASD with dFNC in functional state 2 and ADOS score measured. Blue circles represent the TD controls with dFNC in functional state 2 and ADOS score measured. Asterisks indicate the significance (FDR corrected, q = 0.05).

