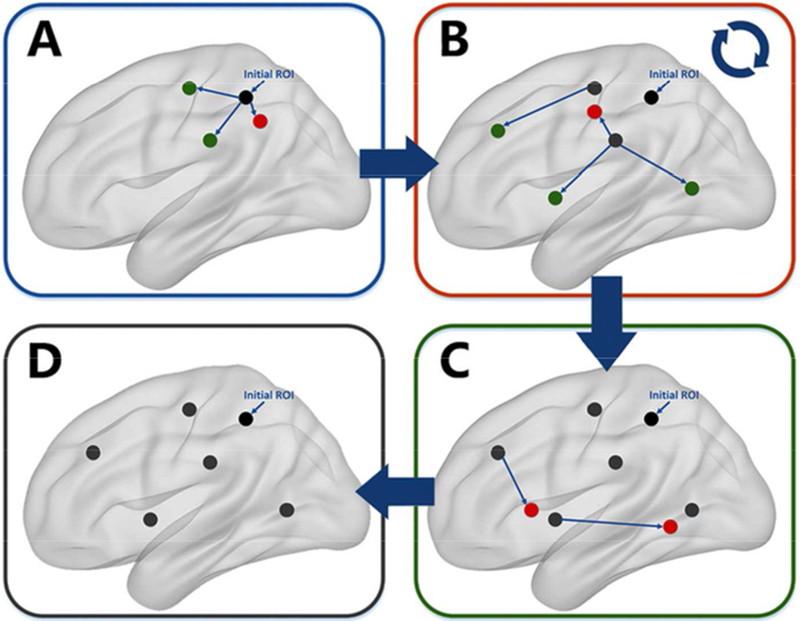
Figure.1.

Flowchart of recurrent-seek strategy
A: For the ROI revealed by the functional ‘connectedness’ map (black), seed-FC analysis was applied based on the initial ROI to reveal new ROIs showing atypical FC by picking the peak points (expanded to 6-mm radius sphere) of the atypical clusters in ASD. B: The newly revealed ROIs located too close to the existing ROIs were excluded (red). For the remaining newly revealed ROIs (green), seed-FC analysis were applied to reveal new ROIs. C: Step B was repeated until no new ROIs could be found. D: Finally, the ROIs with atypical FC in ASDs were revealed and utilized for subsequent analysis.
