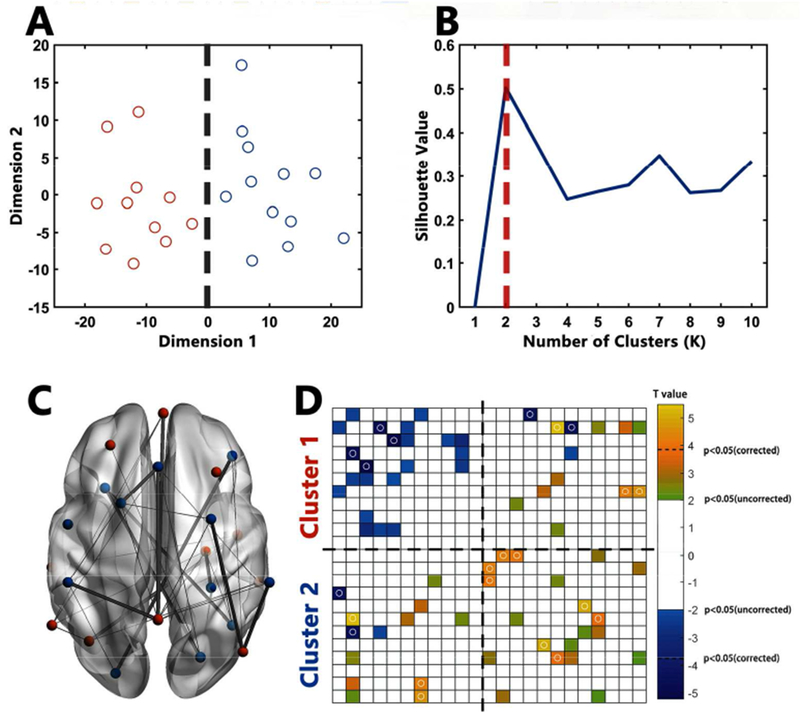
Figure.2.

Atypical FCs in ASD
A: Points in 2D scatter plot represent 23 ROIs after multi-dimension scaling. Near points in the plot indicating similarity in the pattern of FC. Red points represent ROIs belonging to Cluster1 while blue points represent ROIs belonging to Cluster2; B: Silhouette plot of the k-means clustering. Multi-dimension scaling and Silhouette plots showed high consistence in the existence of two clusters of these 23 ROIs. C: The location of ROIs and atypical ROI-by-ROI connections in ASD. Red ROIs represent regions belonging to Cluster1 while blue ROIs represent regions belonging to Cluster2. For connections, thin lines represent connections showing significant differences between HC and ASD at the significance level at p < 0.05 (uncorrected); thick lines represent connections showing significant differences between HC and ASD at the significance level at p < 0.05 (Bonferroni corrected). D: Atypical FCs in ROI-by-ROI matrices in ASD. Yellow blocks represent connections showing higher FC in ASD (p < 0.05, uncorrected) while blue blocks represent connections showing lower FC in ASD (p < 0.05, uncorrected). Blocks with circles represent connections surviving Bonferroni correction. The order of ROIs is in accordance with Table 2.
