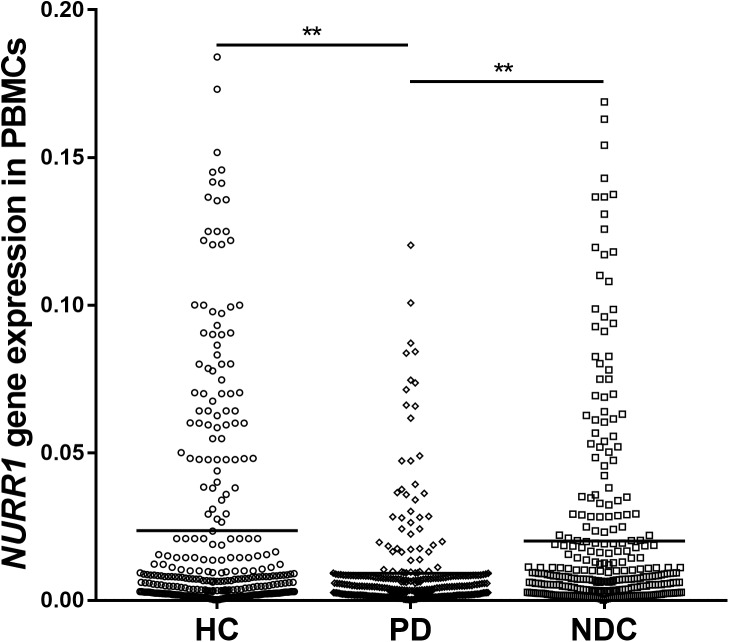
FIGURE 1.
Scatter plots of NURR1 gene relative mRNA expression level in the PBMCs of HC (n = 318), PD (n = 312), and NDC (n = 332), which was determined using real-time PCR assays. Horizontal bars represent mean value. The NURR1 gene mRNA level in the PBMCs was markedly low in patients with PD (mean ± SEM, 0.009 ± 0.0009) as compared with HC (mean ± SEM, 0.023 ± 0.0021) and various NDC (mean ± SEM, 0.019 ± 0.002). ∗∗p < 0.01.

