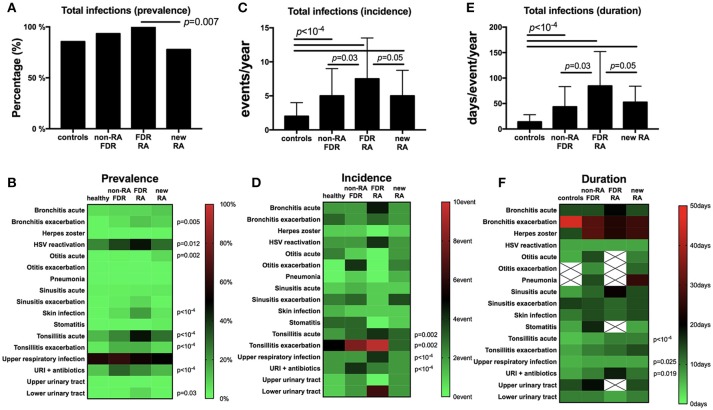
Figure 2.
Infection prevalence, incidence and duration are increased in the FDR-RA subgroup at baseline. (A,B): total (A) and individual (B) infection prevalence in the previous year in controls, non-RA FDR, FDR-RA and new RA. (C,D): total (C) and individual (D) infection incidence (number of event/year). (E,F): total (E) and individual (F) infection duration (day/event/year). new RA, newly diagnosed RA patients; FDR, first degree relatives; FDR-RA, FDR individuals having developed RA; FDR, individuals not having developed RA; URI, upper respiratory infections; HSV, herpes simplex virus infection. Hatched squares mean that no data were available. Statistics are indicated when p < 0.05 and for individual infections the p-values were corrected using the Benjamini–Hochberg method (58 tests).

