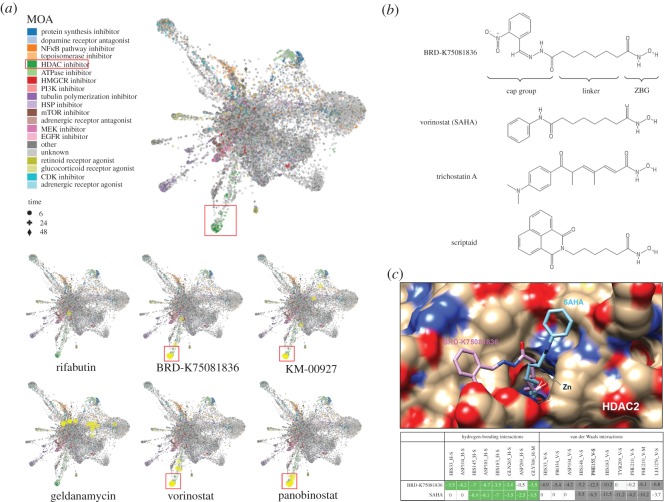
Figure 2.
L1000FWD and molecular docking analyses of predicted HDAC inhibitors. (a) Upper part: gene signatures of drugs with known MOA were coloured and clustered. The red box indicated the cluster of HDAC inhibitors. Lower part: the gene signatures of drugs were queried online and visualized with the yellow circles. (b) The chemical structures of BRD-K75081836, vorinostat/SAHA, trichostatin A and scriptaid. (c) The upper part: the best docking model of BRD-K75081836 or SAHA to HDAC2. The lower part: the interaction residues of HDAC2 to BRD-K75081836 or SAHA.

