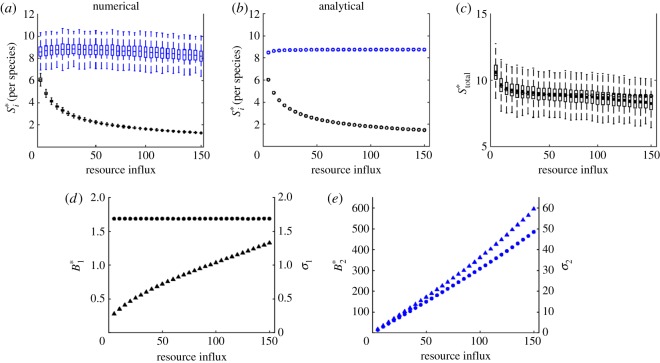
Figure 2.
Stability in a bi-trophic food chain. (a–c) Numerical and analytical results for stability per species, and stability of total biomass. Invariability for each species is calculated as the ratio of equilibrium biomass and the standard deviation of biomass (d,e). Colour and subscript indicate species: basal resource (black, 1) and primary producer (blue, 2). In (a,c), solid bars indicate the mean values of 1000 simulations. Boxes represent the 25th and 75th percentiles of simulation results. Whiskers correspond to approximately 2.5 standard deviations from the mean. In (d,e), the marker shape denotes equilibrium biomass (circle) and standard deviations of biomass (triangle). Markers are the mean value of the simulation results.

