Figure 7.

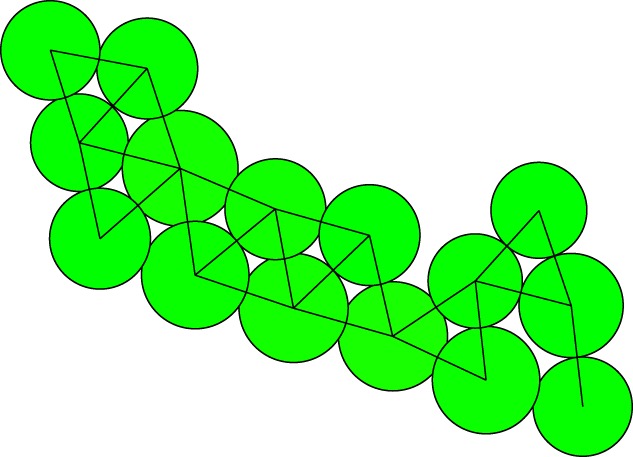
Sample after 100 iterations. Cells are visualized as circles with radius that of the size parameter R, lines indicate connected cells.

Sample after 100 iterations. Cells are visualized as circles with radius that of the size parameter R, lines indicate connected cells.