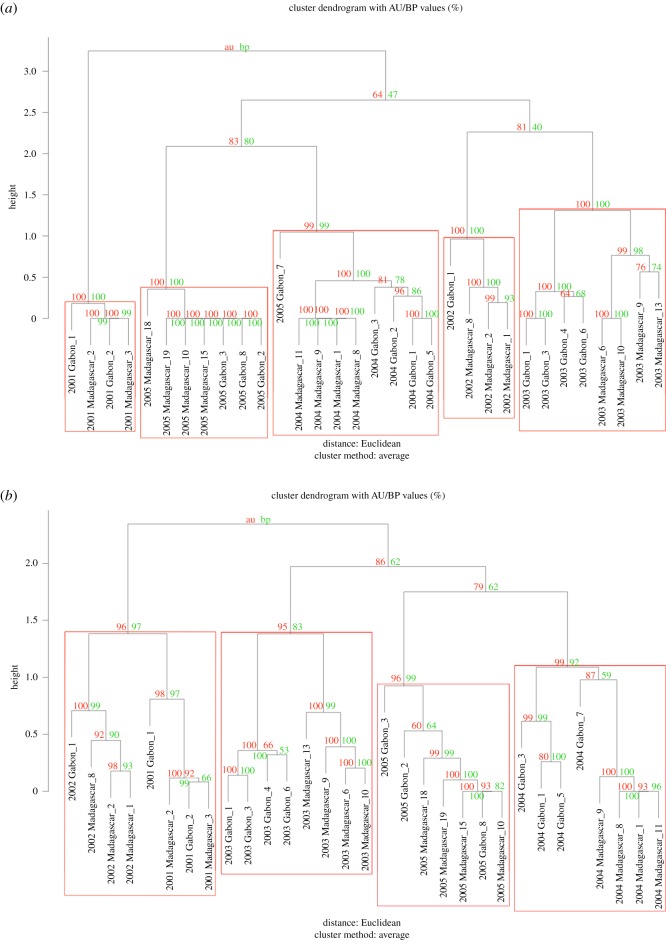
Figure 3.
Average-linkage cluster dendrogram of the median or most representative song (theme sequence) per individual for (a) the Levenshtein similarity index and (b) Dice's similarity index. Multiscale bootstrap resampling (AU, left, red) and normal bootstrap probabilities (BP, right, green) are considered significant if p > 95% and if p > 70%, respectively. Branches with high AU values are strongly supported by the data. Individuals within a red box represent a song type and potentially a ‘vocal population’, labelled by year, location and individual number (note: individual numbers are arbitrary; e.g. individual 1 in 2001 Gabon is not the same individual in 2003 Gabon).

