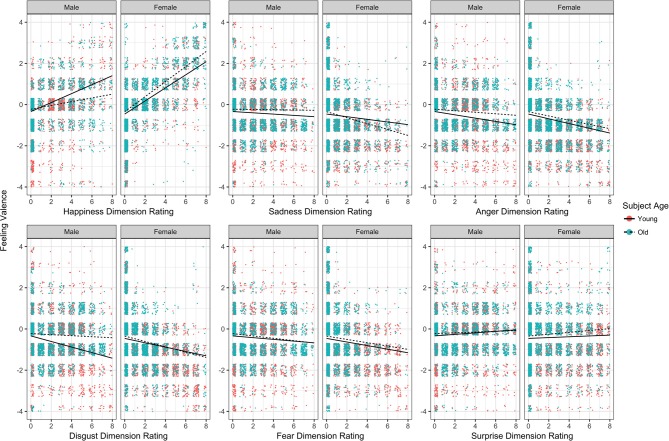
Figure 5.
Jittered scatter plots depicting the relationships between emotion rating intensity and subjectively experienced affect, for each dimension of rated emotion, for young and old, male and female groups. Overlaid regression lines are based on the estimated coefficients from the MCMC model (see Supplementary Table 2).

