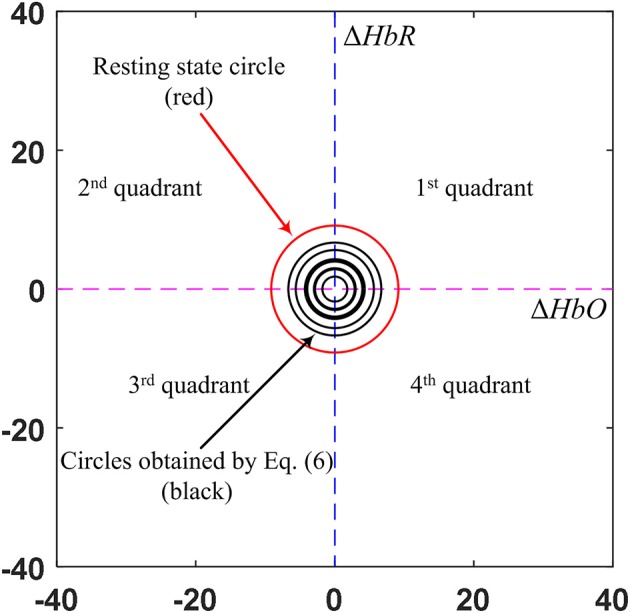
Figure 5.

Comparison of the circles (in black) obtained by the EEG activated window upon trials and the resting state threshold circle (in red) (Sub. 3).

Comparison of the circles (in black) obtained by the EEG activated window upon trials and the resting state threshold circle (in red) (Sub. 3).