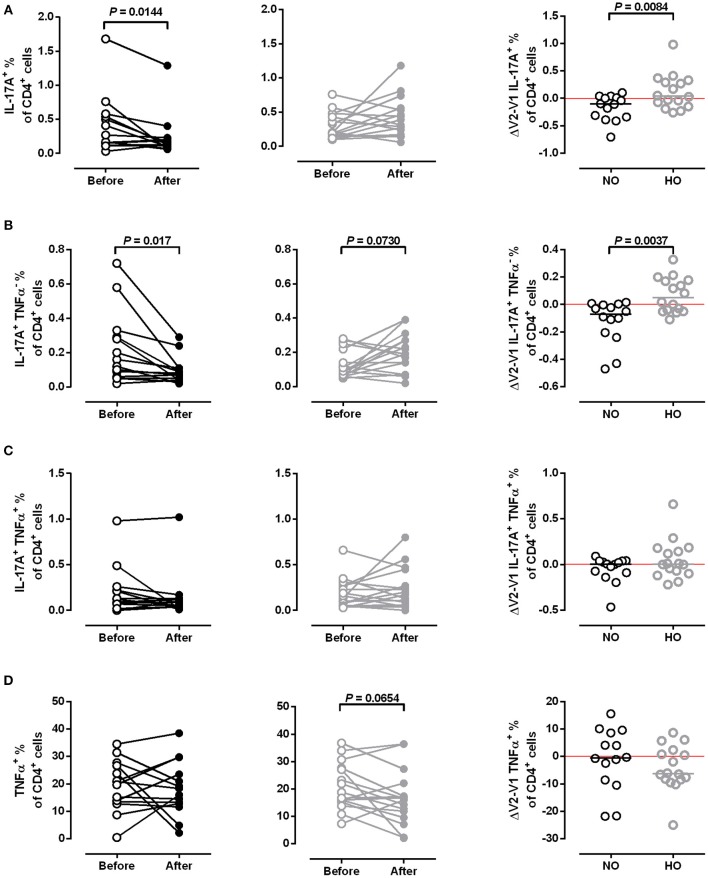
Figure 6.
Frequency of IL-17A and TNFα producing T cells. Frequencies of (A) total IL-17A+, (B) IL-17A+ TNFα−, (C) IL-17A+ TNFα+, and (D) TNFα+ CD4+ cells in MS patients after 4 weeks of normoxic (NO, n = 16, black circles) and hypoxic (HO, n = 14, gray circles) treadmill training. Three samples not analyzed due to quality issues. Comparison of training effects (ΔV2-V1, right column). P-values before vs. after training by Student's paired t-test or Wilcoxon signed rank test. P-values NO vs. HO by Mann-Whitney U test or Student's t-test.

