
Figure 4.
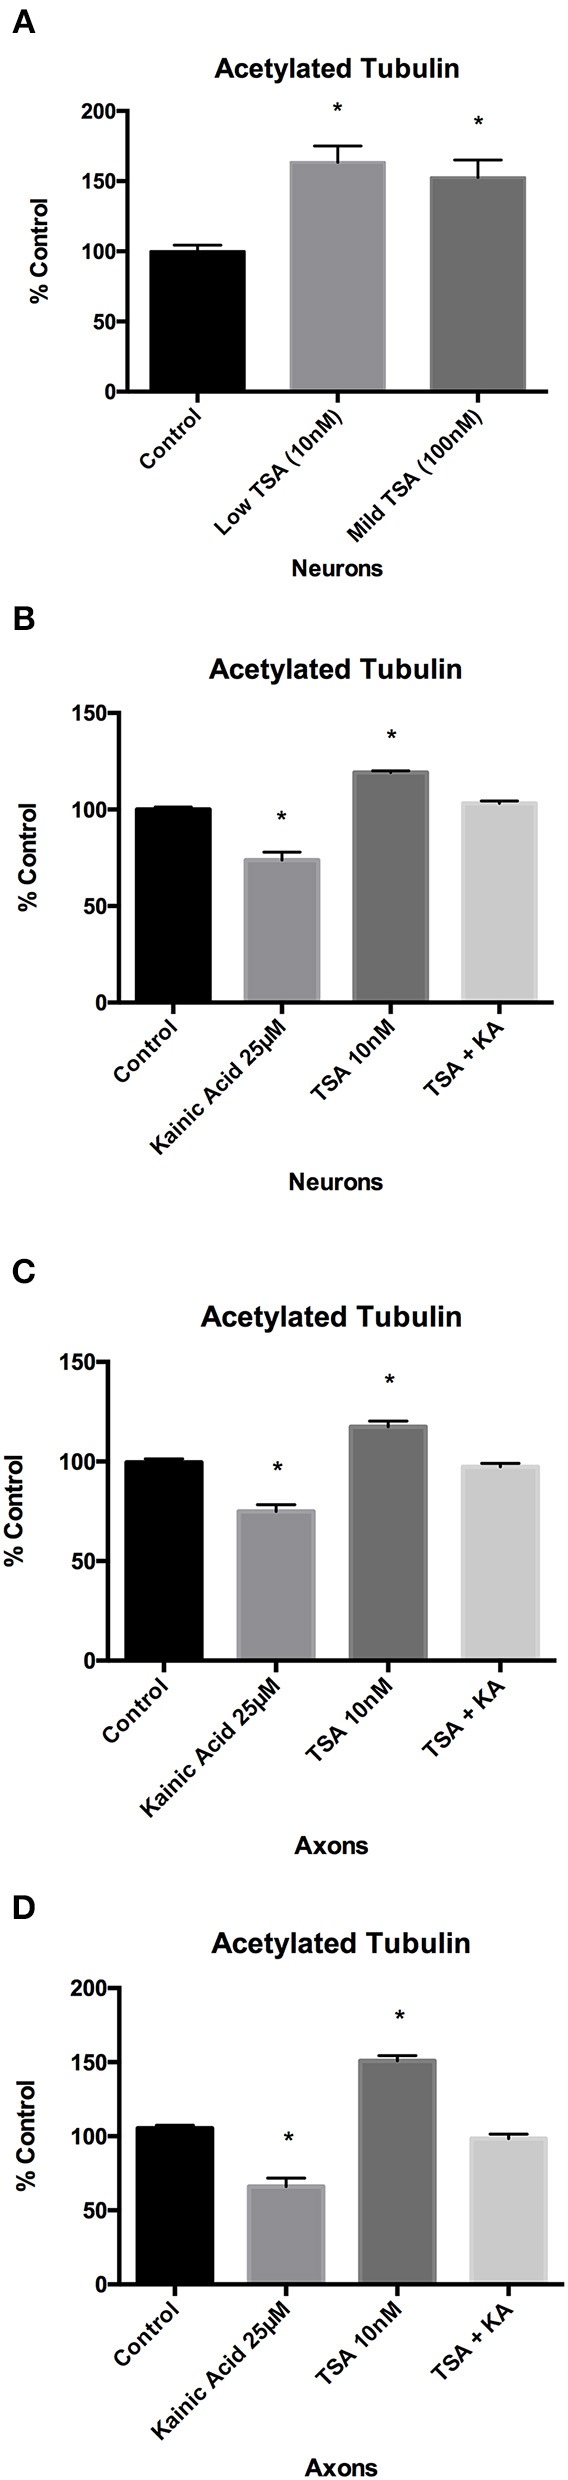
Effect of trichostatin A on microtubule acetylation following kainic acid treatment. Acetylated tubulin levels in whole cultured neurons were analyzed after 10 and 100 nM of trichostatin A treatment for 2 h. (A) ELISA analysis of acetylated tubulin levels after 10 or 100 nM trichostatin A demonstrated a significant increase (p < 0.05) compared to control. ELISA analysis demonstrated that in (B) whole cultured neurons and (C) isolated axons, 10 nM trichostatin A inhibited the effect of 25 μM kainic acid on acetylated tubulin levels, and the levels of acetylated tubulin levels in kainic acid treated neurons which had been treated with trichostatin A were not significantly different from control, despite the significant decrease (p < 0.05) in acetylated tubulin in cells treated with kainic acid alone. (D) To confirm the ELISA analysis of acetylated tubulin levels a Western blot was performed of harvested isolated axons from neurons treated with 25 μM kainic acid in the presence of absence of axonal trichostatin A (10 nM). This confirmed that trichostatin A rescued the decrease in acetylation resulting from kainic acid treatment. Bar graph represents mean ± SEM *p < 0.05 relative to control. TSA, trichostatin A; KA, kainic acid.