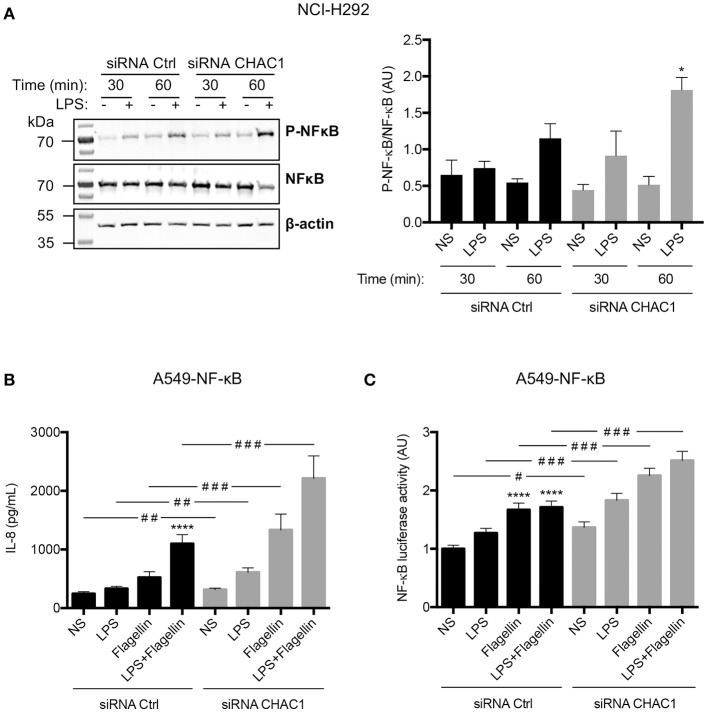
Figure 6.
(A) Phospho-NF-κB (p-NF-κB), total NF-κB (NF-κB), and β-actin protein expression in NCI-H292 cells transfected with siRNA control (siRNA Ctrl) or siRNA CHAC1 for 48 h and then stimulated for 30 min or 1 h with (+) or without (–) 1 μg/mL LPS (images are representative of four independent experiments; left panel). Results are shown as p-NF-κB/NF-κB ratios (right panel). Data are expressed as means ± SEMs of four experiments. Statistical analysis was carried out using Mann-Whitney tests (*p < 0.05, siCtrl-LPS 1 h vs. siCHAC1-LPS 1 h). (B) IL-8 production and (C) NF-κB luciferase activity in A549-NF-κB luciferase cells transfected with siRNA control (siRNA Ctrl, black) or siRNA CHAC1 (gray) for 48 h and stimulated with LPS and/or flagellin for 24 h. Data are expressed as means ± SEMs of four independent experiments. Statistical analysis was performed using analysis of variance followed by Dunnett's multiple comparison tests (control group: NS, ****p < 0.0001) and Wilcoxon test (siRNA Ctrl vs. siRNA CHAC1 groups, #p < 0.05; ##p < 0.01; ###p < 0.001).

