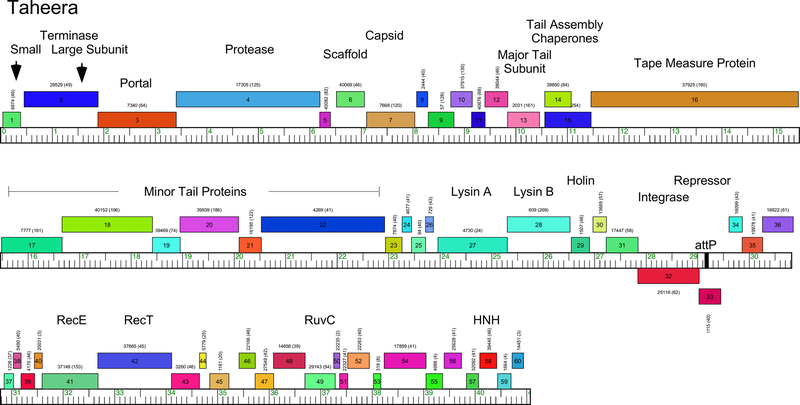
Figure 3. Genome organization of mycobacteriophage Taheera.
The genome of phage Taheera (Cluster G) is represented as a scale bar (major intervals: 1 kbp) with predicted genes shown as boxes either above (rightwards transcribed) or below (leftwards transcribed). Gene numbers are shown within each box and the phamily designation is shown either above or below with the number of phamily members shown in parentheses. Putative gene functions are indicated.

