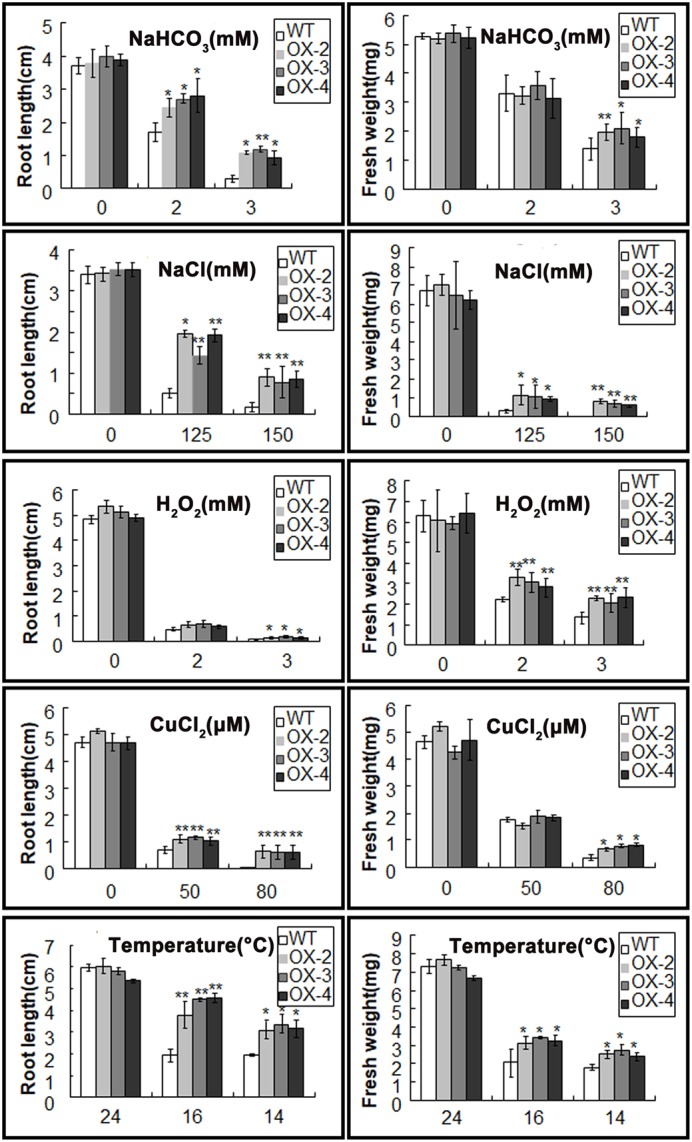
FIGURE 7.

Root length and fresh weight of wild-type (WT) and ChACBP1-overexpressing transgenic plants after indicated stress treatments. Values are mean ± SE of four plants. Significant differences (P < 0.05) were determined by t-test. Asterisks indicate significant differences from WT (∗∗P < 0.01, ∗0.01 < P < 0.05).
