
Figure 2.
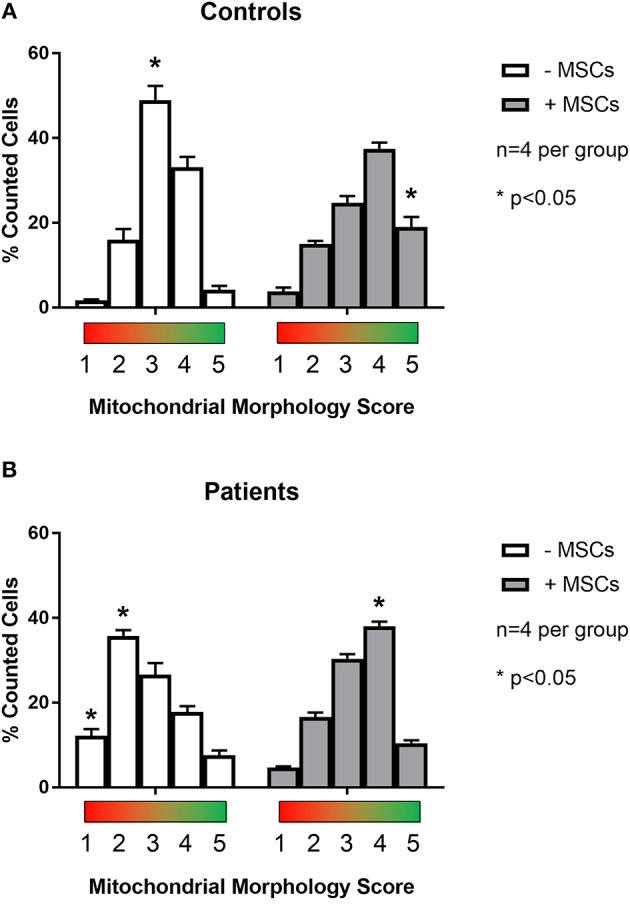
Quantification of mitochondrial morphology scores between patient and control cells. Skin fibroblasts from healthy controls (A) and patients with a clinically diagnosed mitochondrial disease (B) were manually classified into one of five mitochondrial morphology categories. Category 1 (red) corresponds to a fully fragmented morphology and category 5 (green) corresponds to a fusion morphology. Results from baseline were compared following contact co-culture with mesenchymal stem cells (MSCs). A minimum of 150 cells were quantified per metric and per condition from 2 to 3 independent experiments. All data are mean ± SEM with n = 4 for each group. *Denotes statistical significance at p < 0.05.