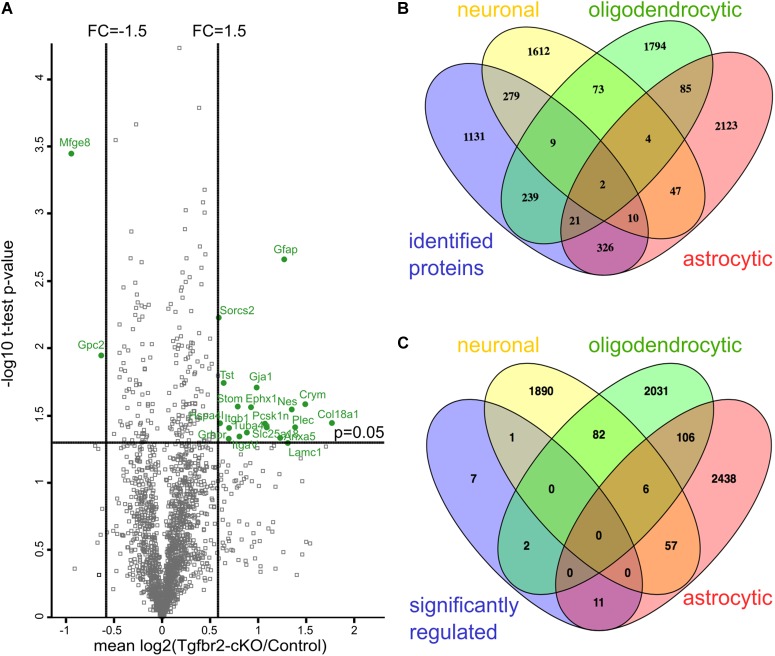
FIGURE 1.
Quantitative proteomics reveals differential expression of astrocyte proteins after neural deletion of the Tgfbr2. (A) Scatterplot of identified proteins. Proteins with more than 1.5 fold change alteration and with a p-value < 0.05 in one-sample t-test are shown in green. Results are shown as mean values of the log2(fold change) of at least two out of four experiments. FC: fold change; one-sample t-test with cut-off at p = 0.05. (B) Comparison of all identified proteins of the proteome with gene arrays from Cahoy et al. (2008) demonstrate that proteins from the three major cell lineages of the CNS were identified. (C) Comparison of 21 significant differentially altered proteins with the gene arrays from Cahoy et al. (2008) shows 11 astrocyte-specific proteins.

