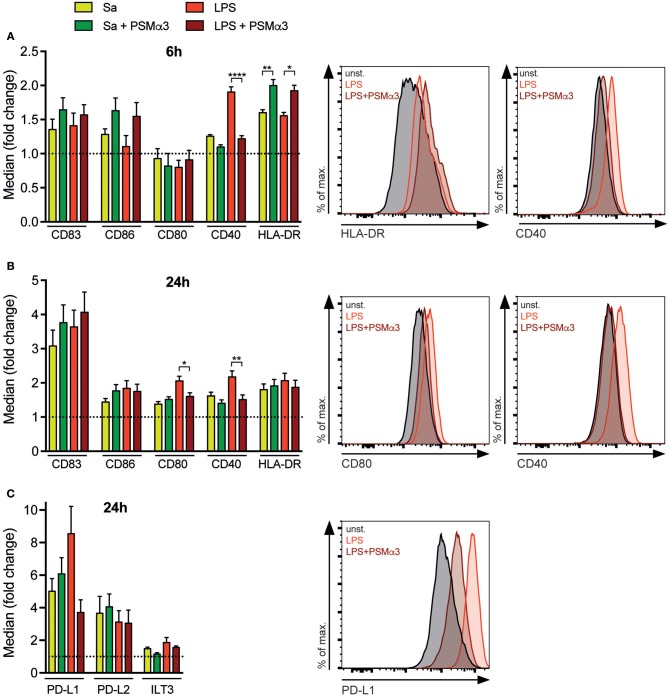
Figure 1.
PSMs modulate surface molecule expression of TLR-treated moDCs. MoDCs were treated with Sa lysate or LPS with or without PSMα3 for 6 h (A) or 24 h (B,C) and analyzed by flow cytometry. MoDCs were characterized as living CD11c+HLA-DR+ cells and the expression of the indicated costimulatory (A,B) and inhibitory molecules (C) was determined. The graphs show the mean fluorescence intensity of the respective marker expression as fold change of untreated cells. The graphs show n ≥ 3 independent experiments (mean ± SEM) performed in triplicates. Representative histogram overlays of HLA-DR and CD40 after 6 h (A), CD80, CD40 (B), and PD-L1 (C) after 24 h. *p < 0.05, **p < 0.005 or ****p < 0.0001, one-way ANOVA with Turkey's posttest or Kruskal-Wallis with Dunn's posttest.

