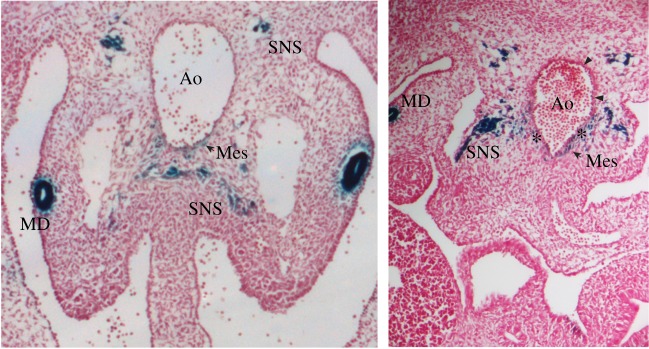
Figure 1.
Gata3 expression in the AGM region. Images show cryosections of Gata3+/Lz [114] E11.5 embryos stained with X-Gal for β-galactosidase activity (blue) and counterstained with Neutral Red. Ao, aorta; MD, mesonephric duct; Mes, mesenchyme; SNS, sympathetic nervous system; asterisks indicate Gata3 staining underneath haematopoietic clusters; arrowheads point to individual Gata3-expressing endothelial cells.

