
Figure 3.
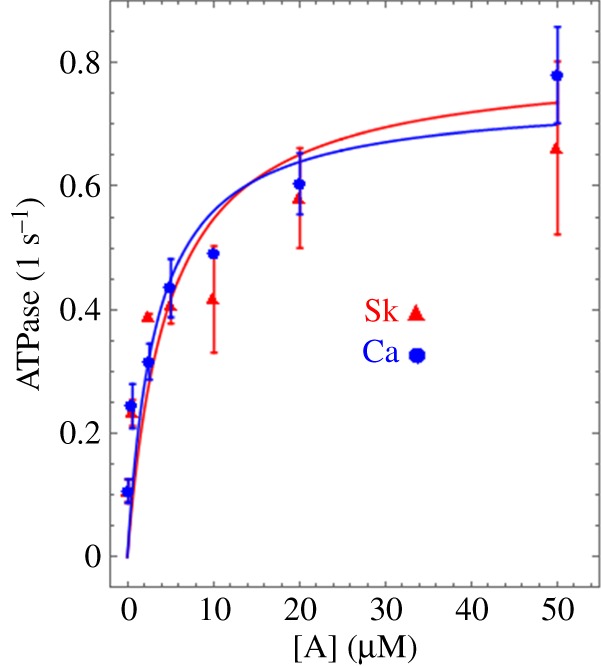
Actin-activated βmys ATPase in inverse seconds versus micromolar actin concentration [A] for cardiac (Ca, blue) and skeletal (Sk, red) actin. Error bars show standard deviation for sampling statistics given in table 1 and under experimental conditions given in Methods. Fitted curves use equation (2.1). Difference between ATPase rate versus [A] for cardiac and skeletal actin is negligible.