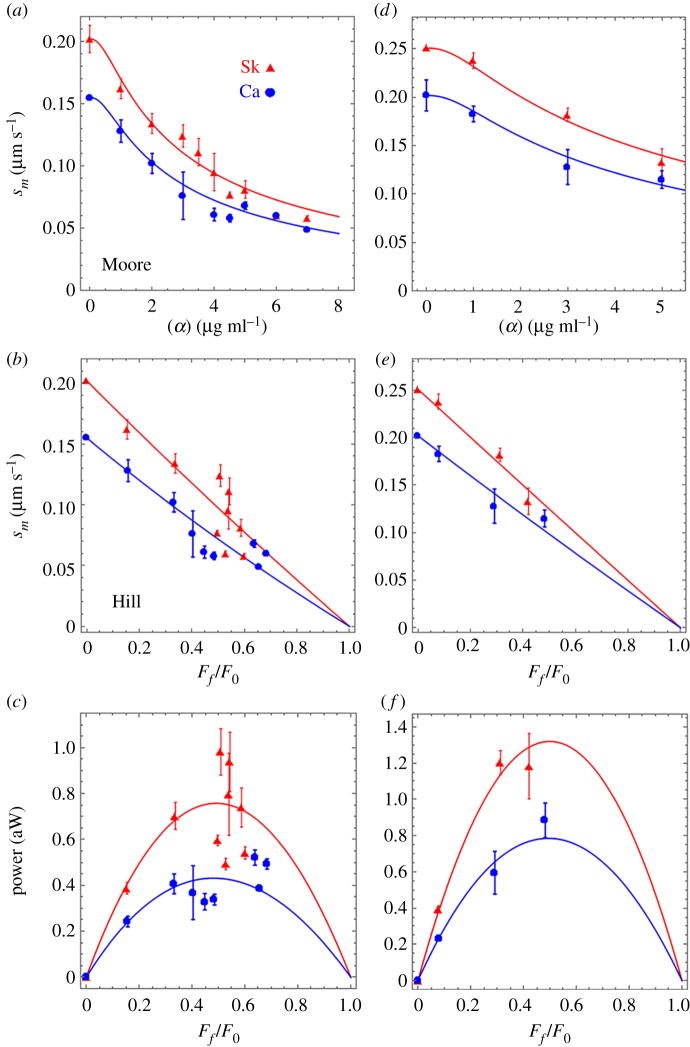
Figure 4.
βmys loaded in vitro motility assay for skeletal (Sk, red) or cardiac (Ca, blue) actin. (a) Motility velocity, sm, versus α-actinin concentration. (b) Motility velocity as in (a) versus normalized frictional force Ff/F0 for Ff the frictional loading force and F0 isometric force. (c) Power versus Ff/F0. Error bars show standard deviation for 7–31 acquisitions at each α-actinin concentration and under experimental conditions given in Methods. Fitted curves are based on equations (2.2)–(2.6) applied to data as described in Methods. Experimental data appear as discrete points with error bars and fitted curves as solid lines. Significance testing of cardiac versus skeletal datasets in (a–c) indicates they differ significantly in each case with confidence level p < 0.01. Panels (d–f) are identical to (a–c) except for Qdot labelled actin under fewer and slightly different loads and with error bars showing standard deviation for 8–16 acquisitions.

