Figure 3.

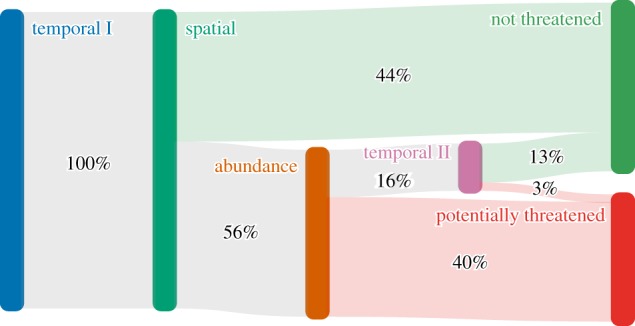
Diagram showing the proportions of species following different pathways towards being classified as potentially threatened or not threatened at each step in the US Method for all plant groups in our study.

Diagram showing the proportions of species following different pathways towards being classified as potentially threatened or not threatened at each step in the US Method for all plant groups in our study.