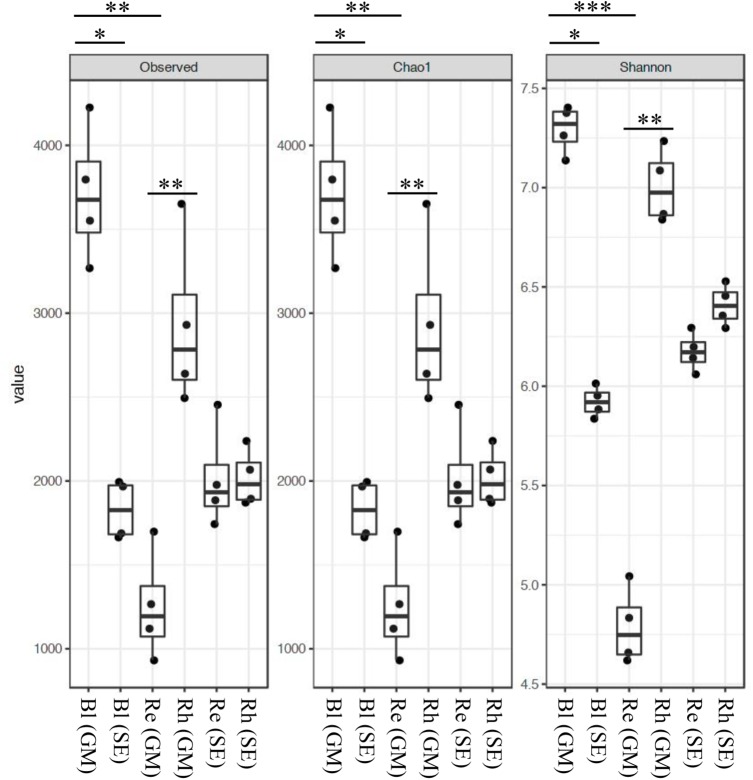
FIGURE 1.
Alpha-diversity indices for the 16S rRNA gene sequences. Box plots of the observed OTUs, Chao1, and Shannon indices in bulk control soil (Bl), root endosphere (Re), and rhizosphere (Rh) samples from both G. maritima (GM) and S. europaea (SE). Whiskers represent the minimum and maximum values. All other points are contained within the box, and the bar represents the median. A Holm-adjusted P-value was calculated from Dunn’s test of multiple comparisons using rank sums. Asterisks indicate statistically significant differences between pairs of values (∗P < 0.05, ∗∗P < 0.01, ∗∗∗P < 0.001).

