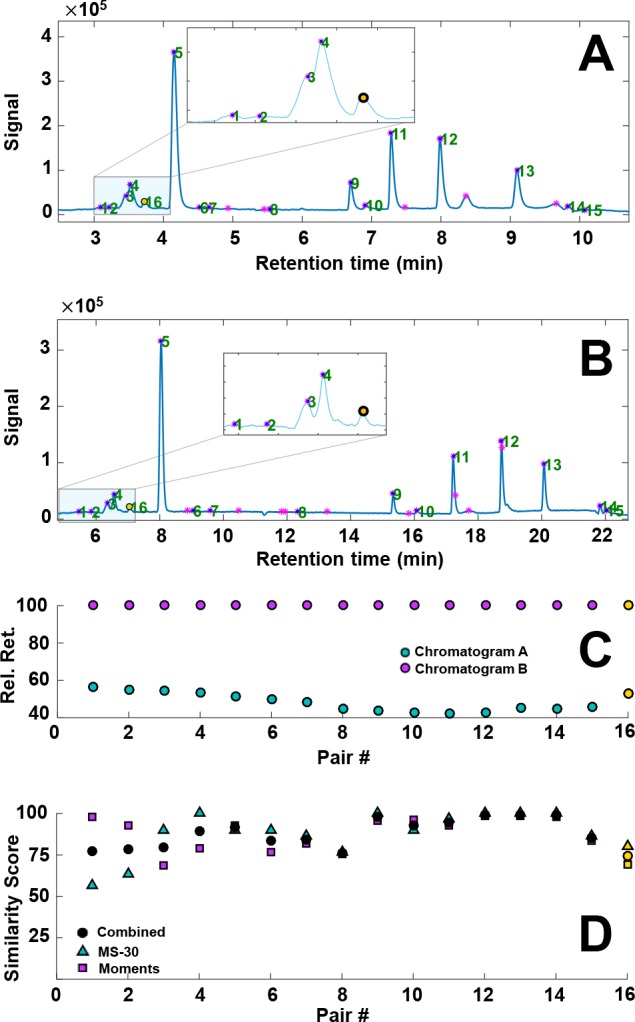
Figure 4.

(A and B) Gradient-scanning LC–MS TIC chromatograms of light-degraded alizarin using a gradient time of (A) 6 and (B) 18 min. Detected, filtered peaks are depicted with purple markers. The green numbers reflect identified peak pairs. (C) The relative retention times of the matched peak pairs in chromatograms A and B, with the latter set to 100%. (D) Plot of the similarity scores based on statistical moments (■), mass spectra (▲), and the combined score (●) for each peak pair. MS-30 = similarity between the 30 most abundant peaks on the MS spectra (see the Spectrometric Similarity section). The yellow marked peaks are discussed further in the text.
