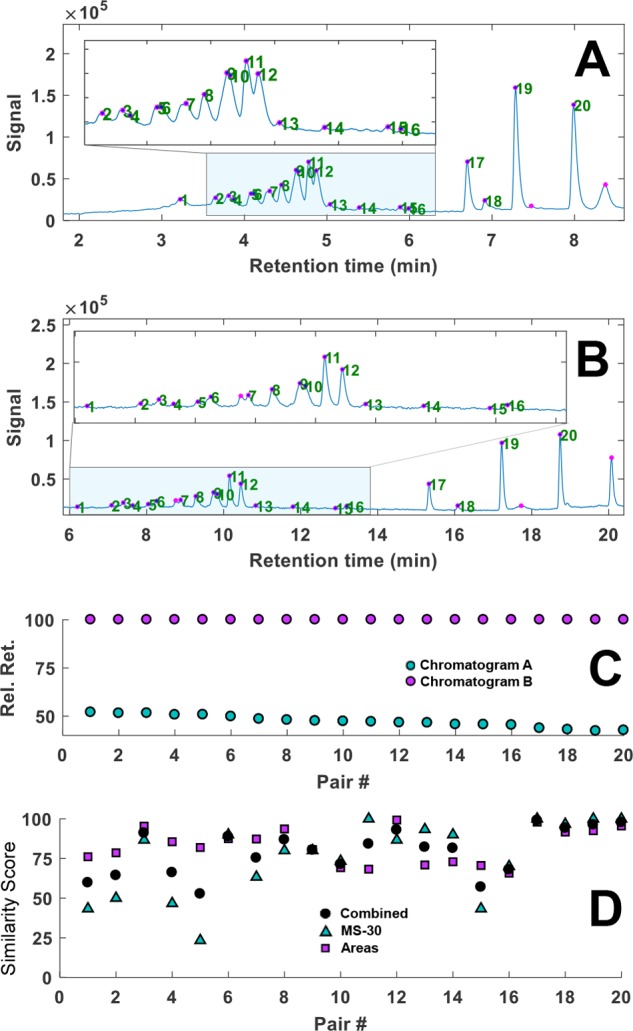
Figure 5.

(A and B) Gradient-scanning LC–MS TIC chromatograms of light-degraded eosin using gradient times of (A) 6 and (B) 18 min. Detected, filtered peaks are indicated with purple markers; the green numbers reflect identified peak pairs. (C) The relative retention times of the matched peak pairs in chromatograms A and B, with the latter set to 100%. (D) Plot of the similarity scores based on statistical moments (■), mass spectra (▲), and the combined score (●) for each peak pair. MS-30 = similarity between the 30 most abundant peaks on the MS spectra (see the Spectrometric Similarity section).
