Figure 1.

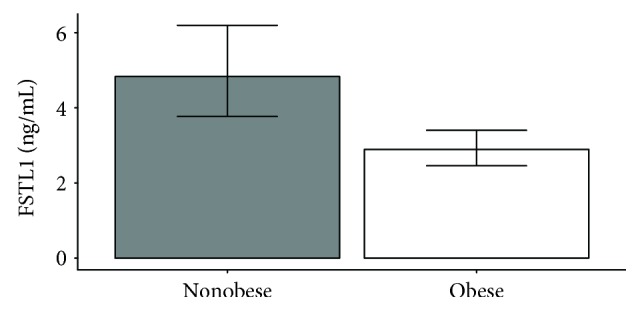
FSTL1 protein level in obese and nonobese participants. Quantification of FSTL1 protein levels obtained by ELISA kit for obese subjects (n = 81) and nonobese controls (n = 52), p = 0.044, Student's t-test.

FSTL1 protein level in obese and nonobese participants. Quantification of FSTL1 protein levels obtained by ELISA kit for obese subjects (n = 81) and nonobese controls (n = 52), p = 0.044, Student's t-test.