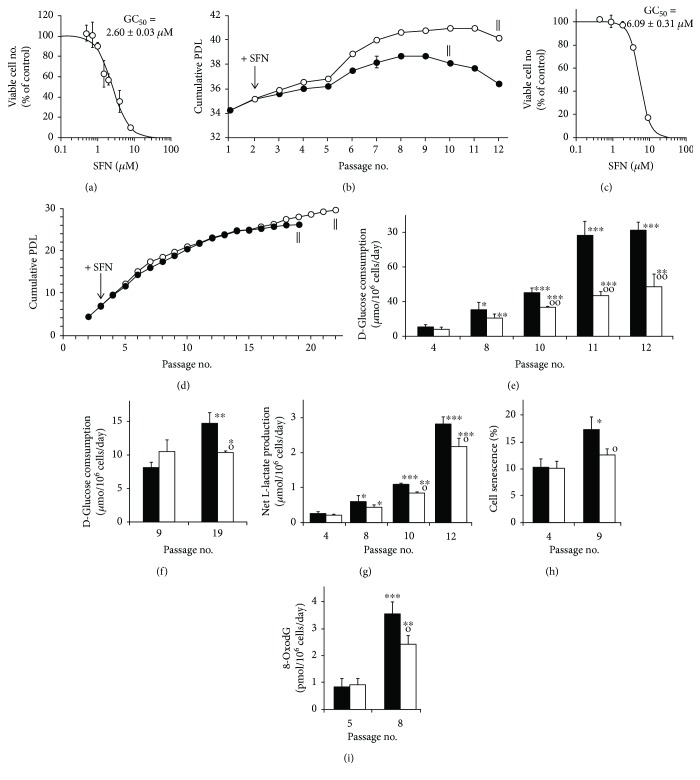
Figure 1.
Delay of replicative senescence in MRC-5 and BJ fibroblasts by sulforaphane and link to suppression of glucose consumption. (a) Concentration-response curve for the effect of SFN on the growth of MRC-5 fibroblasts in vitro. The median growth inhibitory concentration GC50 of SFN was 2.60 ± 0.03 μM and n logistic regression coefficient n = 2.02 ± 0.03. (b) Growth of MRC-5 fibroblasts to senescence with delay by SFN. ‖ indicates when cells stopped growing and thereafter decreased in viability (ΔPDL < 0). Treatment effect, P = 2 × 10⁻⁵, and time × treatment interaction, P = 0.004; repeated measures. (c) Concentration-response curve for the effect of SFN on the growth of BJ fibroblasts in vitro. GC50 of SFN was 6.09 ± 0.31 μM and n = 3.04 ± 0.05. (d) Growth of BJ fibroblasts to senescence. Treatment effect (P = 0.002) and time × treatment interaction (P = 0.009; repeated measures). Key: ↓ initiation of treatment with 1 μM SFN (○▬○) and control, +0.002% DMSO (●▬●), one treatment per passage. (e, f) Glucose consumption in selected passages of MRC-5 and BJ fibroblast cultures from experiments in (b) and (d). For MRC-5 cells, treatment effect, P = 0.003, and treatment × time interaction, P = 0.004; repeated measures. For MRC-5 cultures: (g) net production of L-lactate (treatment effect, P = 0.003; repeated measures); (h) β-galactosidase-stain senescence; and (i) flux of formation of DNA oxidation adduct, 8-oxodG, in cell cultures from experiment in (b). Key: solid bars, control; unfilled bars, +1 μM SFN. Significance: ∗, ∗∗, and ∗∗∗, P < 0.05, P < 0.01, and P < 0.001 with respect to cPDL of untreated control at passage 4 control of MRC-5 fibroblasts (e, g–i) and passage 9 control of BJ fibroblasts (f); o and oo, P < 0.05 and P < 0.01 with respect to untreated control of the same passage; t-test; N = 3 except N = 21 and N = 17 for determination of GC50 values for SFN in MRC-5 and BJ cells, respectively.

