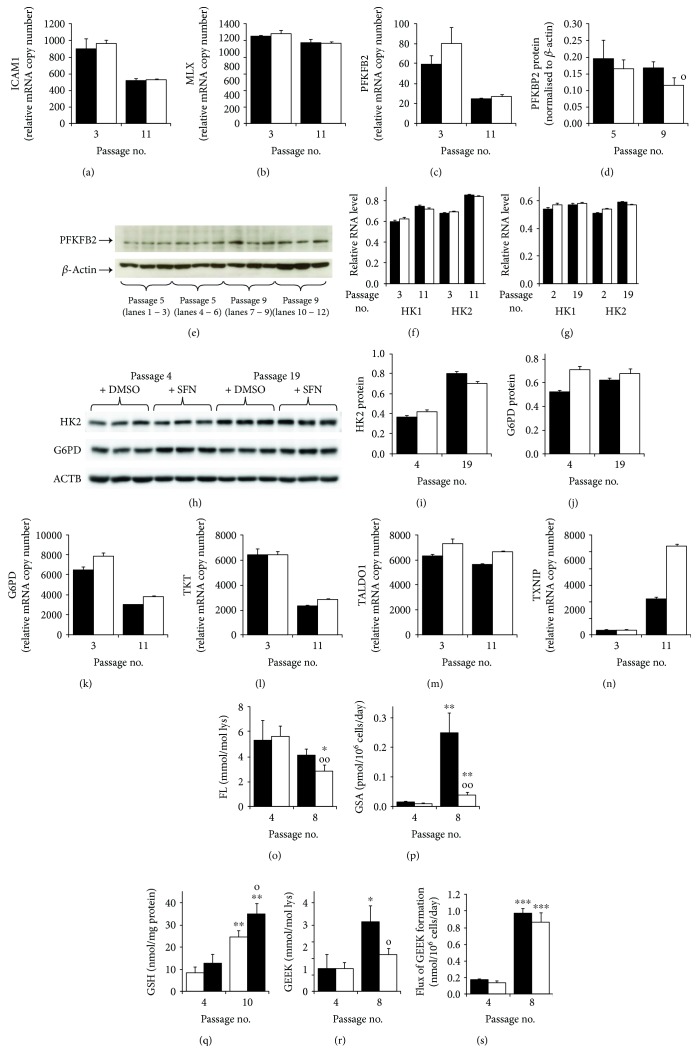
Figure 4.
Mechanism of decreased glucose consumption by sulforaphane in delay of fibroblast senescence in vitro. Key (bar charts): solid bars, control; unfilled bars, +1 μM SFN. Expression of regulatory glycolysis genes: (a) MLXIP or Mondo A (0.002), (b) MLX (P = 0.008), and (c) PFKBP2 (P = 0.019) (NanoString analysis). (d, e) PFKBP2 protein – quantitation and related Western blot, respectively. (f) MRC-5 fibroblast HK mRNA: HK1 (P = 0.008, P ″ = 0.021) and HK2 (P = 6 × 10⁻⁵, P ″ = 0.039). (g) BJ fibroblast HK mRNA: HK1 (P = 0.04, P′ = 0.016) and HK2 (P = 0.003, P ″ = 0.022) (RT-PCR analysis, relative to β-actin). (h) Western blotting of cell protein from BJ fibroblasts at passages 4 and 19 for antigens HK2, G6PD, and reference β-actin (ACTB). (i) Quantitation of HK2 protein (P = 0.002, P ″ = 0.015) and (j) quantitation of G6PD protein (P = 0.036, P′ = 0.012, and P ″ = 0.018) (Western blotting). (k–n) Relative mRNA copy number in MRC-5 fibroblasts: (k) G6PD (P = 0.002, P′ = 0.005), (l) TKT (P = 0.001), (m) TALDO1 (P = 0.016, P′ = 0.007), and (n) TXNIP (P = 1 × 10⁻⁴, P′ = 9 × 10⁻⁴, and P ″ = 2 × 10⁻⁴), Significance: P, passage no effect; P′, +SFN effect; and P ″, passage no × SFN effect. (o–s) Protein damage markers and cellular GSH at passages 4 (nonsenescence) and passage 8 - except passage 10 for GSH (approach to senescence). (o) FL content of cell protein. (p) Flux of formation of protein oxidation adduct, GSA. (q) Cellular concentration of GSH. (r) GEEK cross-link content of cell protein. (s) Flux of formation of GEEK. Significance: P, passage number effect; P′, +SFN effect; and P ″, passage number × SFN effect; ANOVA repeated measures. ∗, ∗∗, and ∗∗∗, P < 0.05, P < 0.01, and P < 0.001 with respect to passage 4 untreated control; o and oo, P < 0.05 and P < 0.01 with respect to passage 8 untreated control; t-test.

