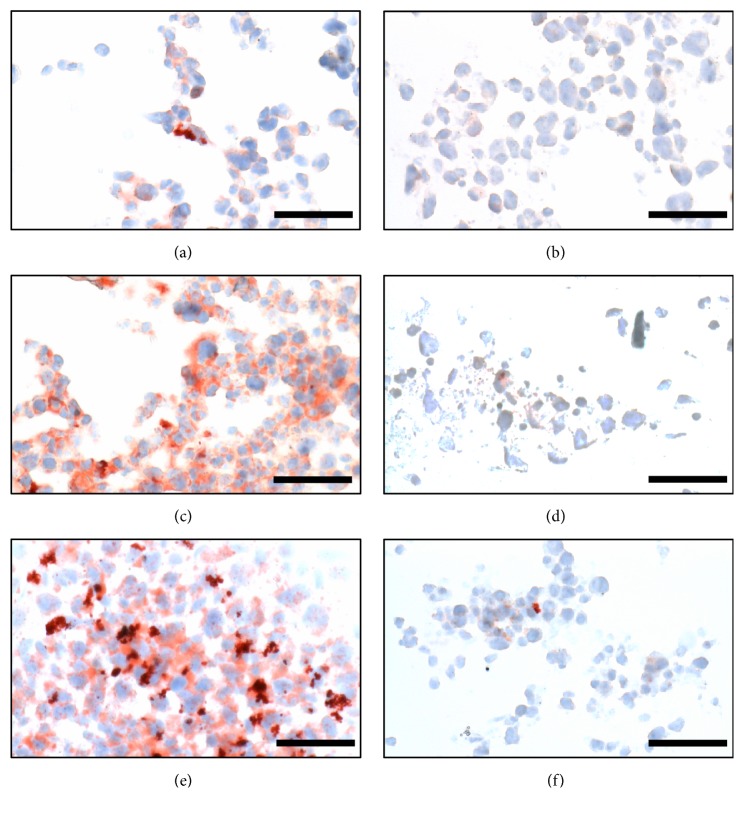
Figure 5.
Characterization of lipid accumulation in 3D foam cell spheroids. Oil Red O (ORO) and haematoxylin staining of cryosections of foam cell spheroids in different conditions. (a–d) Foam cell spheroids treated with 0.1 μg/mL FA, 1 μg/mL FA, 0.1 μg/mL Dex and 1 μg/mL Dex, respectively; (e) untreated foam cell spheroid; (f) negative control: untreated macrophage spheroid. The scale bars represent 50 μm. Images presented were representative of 3 independent experiments, n = 3.

