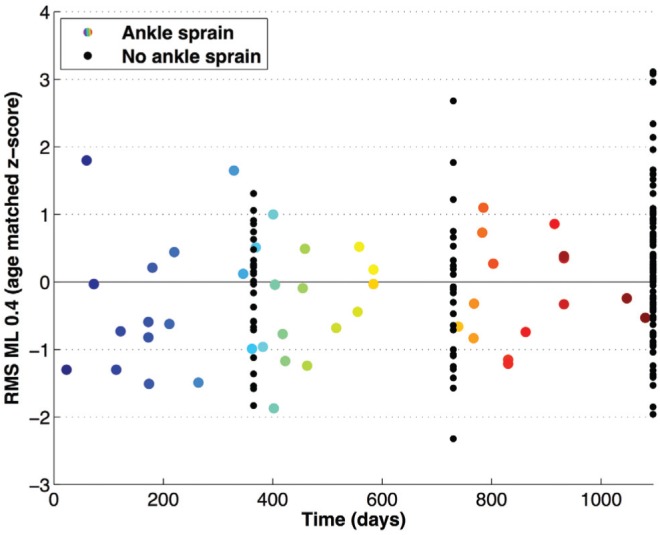
Figure 3.

Scatterplot of all players regarding follow-up length and z score of RMS ML 0.4. The multicolored dots represent the corresponding RMS ML 0.4 z score (y-axis) for those players who sustained an ankle sprain at a certain moment in time (x-axis). The black dots signify the z scores at end of follow-up for the players who did not sustain an ankle sprain (hence, the vertical lines of dots at 1, 2, and 3 years). See Outcome Measures section for definitions.
