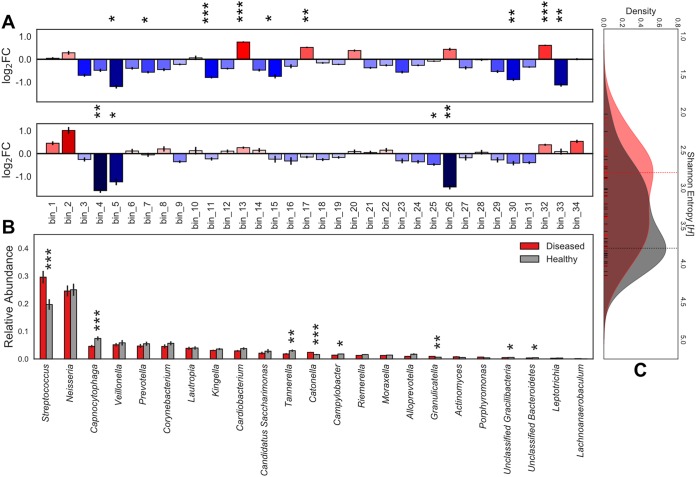
FIG 1.
Core supragingival microbiome composition in the context of health and disease. Microbial community abundance profiles and enrichment in phenotype-specific cohorts. Statistical significance (P < 0.001, ***; P < 0.01, **; and P < 0.05, *). Error bars represent SEM. (A) Mean of pairwise log2 fold changes between phenotype subsets. (Top) Caries-positive versus caries-negative individuals with red indicating enrichment of taxa in the caries-positive cohort. (Bottom) Subjects with caries that has progressed to the dentin layer versus enamel-only caries with blue denoting taxa enriched in the enamel. (B) Relative abundance of TPM values for each genera of de novo assembly grouped by caries-positive and caries-negative cohorts. Actinomyces = 0.36, Alloprevotella = 0.0515, Campylobacter = 0.0124, “Candidatus Saccharimonas” = 0.107, Capnocytophaga = 0.000875, Cardiobacterium = 0.0621, Catonella = 0.000264, Corynebacterium = 0.0552, Granulicatella = 0.00255, Kingella = 0.252, Lachnoanaerobaculum = 0.0791, Lautropia = 0.279, Leptotrichia = 0.0829, Moraxella = 0.215, Neisseria = 0.455, Porphyromonas = 0.136, Prevotella = 0.12, Riemerella = 0.0621, Streptococcus = 0.000901, Tannerella = 0.0061, unclassified Bacteroidetes = 0.0111, unclassified Gracilibacteria = 0.0316, Veillonella = 0.471. (C) Kernel density estimation of Shannon entropy alpha diversity distributions for caries-positive (red) and caries-negative (gray) subjects calculated from normalized core supragingival community composition. Vertical lines indicate the mode of the kernel density estimate distributions for each cohort. Statistical significance (P = 0.0109).

