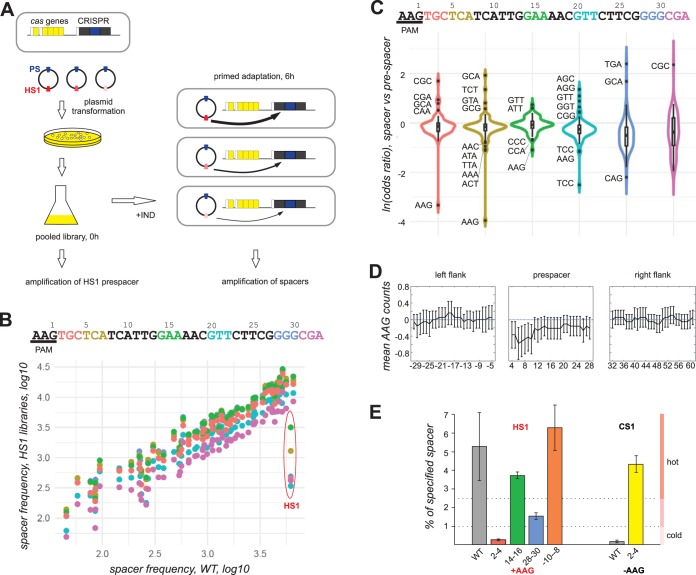
FIG 2.
Experimental demonstration of position-specific AAG avoidance in hot prespacers during primed adaptation. (A) A workflow of the library-based approach to determine the effect of prespacer sequence on acquisition efficiency is presented. Engineered E. coli KD263 cells with inducible expression of cas genes and a CRISPR array with a single G8 spacer are transformed with a library of plasmids containing the G8 priming protospacer (blue) and randomized trinucleotides in the HS1 prespacer (shown by different hues of red); white rectangles represent promoter regions of cas genes and the CRISPR array. Transformants grown on selective medium are pooled and placed in a medium without antibiotic required for plasmid maintenance. The cultures are induced and grown for 6 h to allow primed adaptation to occur. In the pooled culture before induction, the HS1-containing region is amplified and subjected to Illumina sequencing. In the induced culture, the CRISPR array is amplified, and amplicon corresponding to expanded array is subjected to Illumina sequencing. (B) At the top, the sequence of the HS1 prespacer and its PAM is shown. Trinucleotides subjected to randomization in six different libraries are indicated by colors. Below, the frequency of spacers acquired by cells carrying each library is compared to the frequency of spacer acquisition in the initial plasmid (WT). Each dot represents a spacer, and the color of the dot corresponds to the color of the randomized trinucleotide. Dots corresponding to HS spacer and its variants are indicated. (C) Violin plots showing odds ratio of trinucleotides in HS1-derived spacers compared to prespacers in each library. (D) The left, middle, and right plots correspond, respectively, to 33 bp of upstream prespacer flank, the prespacer sequence, and the downstream prespacer flank. Coordinates on the x axis correspond to the center of the 6-bp sliding window, where +1 corresponds to G in AAG PAM. The difference between mean AAG counts in hot and cold prespacer categories is shown in the y axis. The error bars correspond to 95% confidence intervals. (E) Acquisition of HS1 and CS1 spacer variants from individual plasmids carrying trinucleotide substitutions. The bars show the percentage of HS1 and its variants and CS1 and its variant to overall plasmid-derived spacers acquired by cells carrying wild-type pG8mut_Km (WT) or derivatives carrying AAG trinucleotides at specified positions of HS1 or carrying an AAC trinucleotide instead of AAG at positions 2 to 4 of the CS1 prespacer. Mean values obtained from two independent experiments and standard deviations are given.

