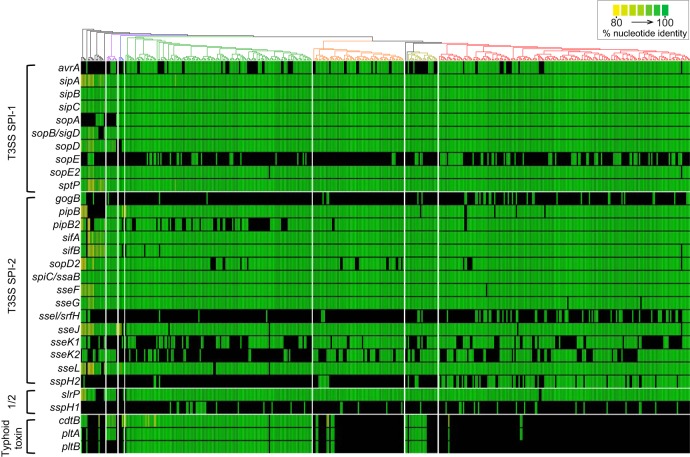
FIG 4.
Distribution of genes encoding T3SS-delivered proteinaceous effectors and typhoid toxins. Shown is the presence or absence of genes coding for proteinaceous effectors delivered by the T3SS encoded in SPI-1, SPI-2, or delivered by both (“1/2”), as well as typhoid toxin subunit-encoding genes. The phylogeny at the top uses the same colors as Fig. 1 for the different clades. Color indicates the hit percentage of nucleotide identity on a linear scale from yellow at 80% to green at 100%. sspH1 and sspH2 were only shown above the 90% threshold to account for the high similarity of the alleles.

