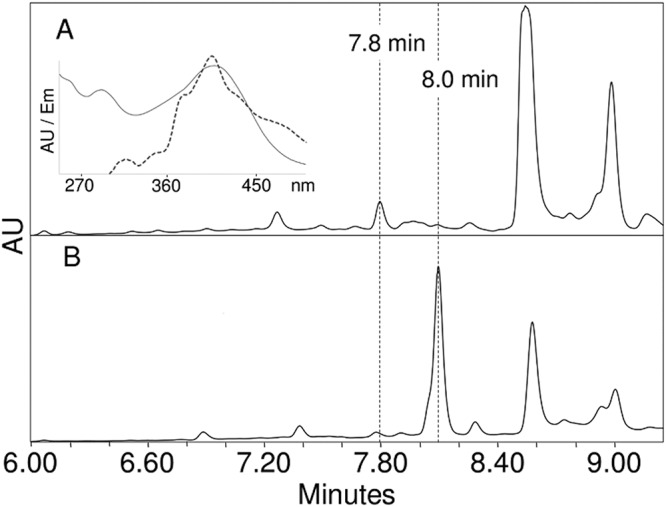
FIG 4.

Separation and characterization of a compound accumulated after UVA induction by the ΔeboC strain. (A) HPLC chromatogram of acetone extract showing production of a novel compound eluting at 7.8 min and the absence of a scytonemin peak at 8 min. This pattern was found in all ebo mutants and in the ΔscyE strain (see Fig. S1 in the supplemental material), and none of the strains produced the compound without an induction of the syctonemin operon (see Fig. S1). The inlay shows the UV-visible light (UV-Vis) absorbance spectrum (solid line) and the fluorescence emission (Em) spectrum (dotted line) of the newly accumulated compound after collection from HPLC eluent. AU, absorbance units. (B) Chromatogram of wild-type extract after UVA induction, indicating the presence of scytonemin at 8 min and the absence of the 7.8-min peak. λ = 407 nm.
