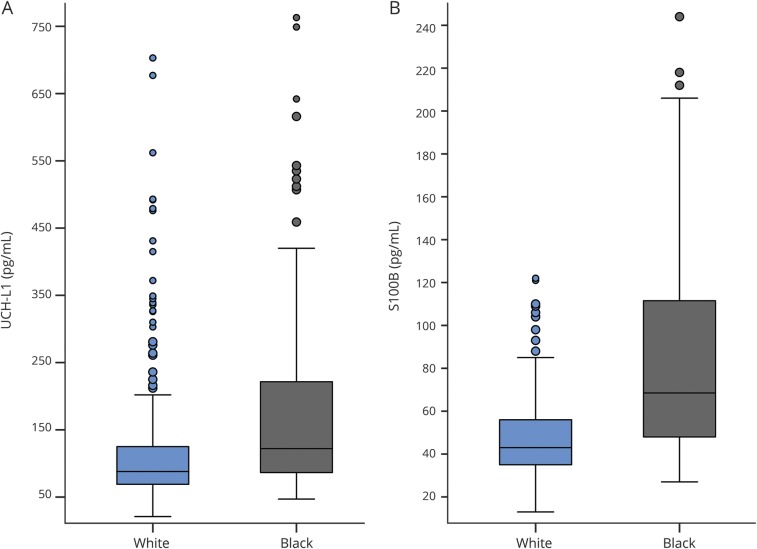
Figure 2. Race-related differences in baseline serum expression of UCH-L1 (A) and S100B (B).
Both differences were statistically significant (p < 0.001) with a medium to large effect size (d = 0.61 for UCH-L1, d = 1.1 for S100B). For the UCH-L1 (A), 5 data points >750 pg/mL (1.2% of sample) were not included in order to minimize y-axis distortion (4 black, 1 white). For the S100B (B), 2 data points >250 pg/mL (0.5% of sample) were not included (2 black). S100B = S100 calcium binding protein B; UCH-L1 = ubiquitin carboxy-terminal hydrolyzing enzyme L1.

